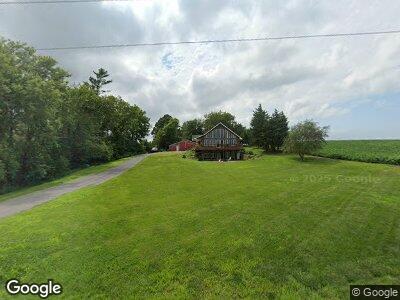
39769 205th Ave Columbus, NE 68601
Estimated Value: $481,000 - $580,000
3
Beds
3
Baths
1,860
Sq Ft
$281/Sq Ft
Est. Value
About This Home
This home is located at 39769 205th Ave, Columbus, NE 68601 and is currently estimated at $522,155, approximately $280 per square foot. 39769 205th Ave is a home located in Platte County with nearby schools including Lakeview High School.
Ownership History
Date
Name
Owned For
Owner Type
Purchase Details
Closed on
Sep 13, 2013
Sold by
Harlen D Harlen D
Bought by
Burns Kerry C and Burns Erin M
Current Estimated Value
Create a Home Valuation Report for This Property
The Home Valuation Report is an in-depth analysis detailing your home's value as well as a comparison with similar homes in the area
Home Values in the Area
Average Home Value in this Area
Purchase History
| Date | Buyer | Sale Price | Title Company |
|---|---|---|---|
| Burns Kerry C | -- | -- |
Source: Public Records
Tax History Compared to Growth
Tax History
| Year | Tax Paid | Tax Assessment Tax Assessment Total Assessment is a certain percentage of the fair market value that is determined by local assessors to be the total taxable value of land and additions on the property. | Land | Improvement |
|---|---|---|---|---|
| 2024 | $3,153 | $486,265 | $37,950 | $448,315 |
| 2023 | $3,535 | $383,480 | $32,300 | $351,180 |
| 2022 | $3,916 | $383,480 | $32,300 | $351,180 |
| 2021 | $3,509 | $365,190 | $27,300 | $337,890 |
| 2020 | $3,148 | $323,235 | $27,300 | $295,935 |
| 2019 | $2,942 | $308,435 | $24,450 | $283,985 |
| 2018 | $2,315 | $242,270 | $24,450 | $217,820 |
| 2017 | $2,224 | $232,165 | $24,450 | $207,715 |
| 2016 | $1,119 | $115,705 | $8,775 | $106,930 |
| 2015 | $588 | $65,060 | $21,140 | $43,920 |
| 2014 | $637 | $65,060 | $21,140 | $43,920 |
| 2012 | -- | $60,610 | $21,140 | $39,470 |
Source: Public Records
Map
Nearby Homes