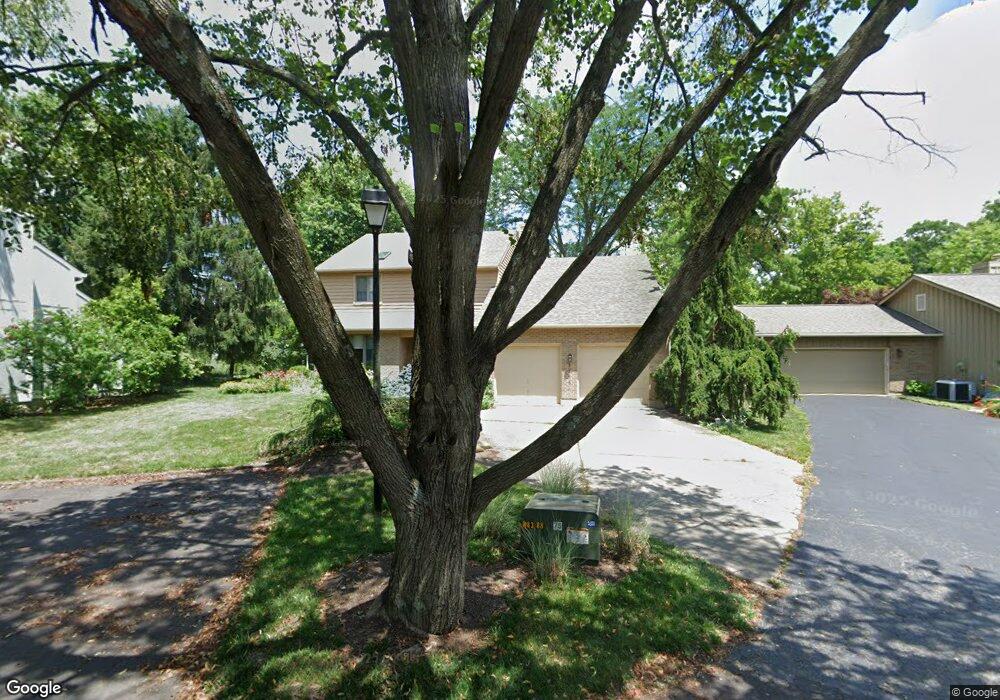
3978 Sunday Ln Maineville, OH 45039
Landen NeighborhoodEstimated Value: $411,370 - $476,000
2
Beds
3
Baths
2,381
Sq Ft
$187/Sq Ft
Est. Value
About This Home
This home is located at 3978 Sunday Ln, Maineville, OH 45039 and is currently estimated at $446,093, approximately $187 per square foot. 3978 Sunday Ln is a home located in Warren County with nearby schools including Kings Junior High School, Kings High School, and King Of Kings Lutheran Early Childhood Education.
Ownership History
Date
Name
Owned For
Owner Type
Purchase Details
Closed on
Oct 9, 2015
Sold by
Dennemann David R
Bought by
Dennemann Martha C
Current Estimated Value
Home Financials for this Owner
Home Financials are based on the most recent Mortgage that was taken out on this home.
Interest Rate
3.76%
Purchase Details
Closed on
Jan 16, 2010
Sold by
Dennemann David R and Dennemann Martha C
Bought by
Dennemann David R and Dennemann Martha C
Purchase Details
Closed on
May 19, 1987
Sold by
Schwallie Charles V and Schwallie Charles V
Bought by
Schwallie and Schwallie Charles
Purchase Details
Closed on
May 15, 1987
Sold by
Roberts Deborah Lynne and Lynne Deborah
Bought by
Schwallie and Schwallie Charles
Purchase Details
Closed on
Aug 1, 1986
Sold by
Landen Farm Company
Bought by
Roberts Homes and Deborah Lynne
Create a Home Valuation Report for This Property
The Home Valuation Report is an in-depth analysis detailing your home's value as well as a comparison with similar homes in the area
Home Values in the Area
Average Home Value in this Area
Purchase History
We collect this data history from publicly available records. To have your information removed, we recommend requesting removal directly through your county’s website.
| Date | Buyer | Sale Price | Title Company |
|---|---|---|---|
| Dennemann Martha C | -- | -- | |
| Dennemann David R | -- | Acs Title & Closing Services | |
| Schwallie | -- | -- | |
| Schwallie | $149,300 | -- | |
| Roberts Homes | -- | -- |
Source: Public Records
Mortgage History
We collect this data history from publicly available records. To have your information removed, we recommend requesting removal directly through your county’s website.
| Date | Status | Borrower | Loan Amount |
|---|---|---|---|
| Closed | Dennemann Martha C | -- |
Source: Public Records
Tax History
| Year | Tax Paid | Tax Assessment Tax Assessment Total Assessment is a certain percentage of the fair market value that is determined by local assessors to be the total taxable value of land and additions on the property. | Land | Improvement |
|---|---|---|---|---|
| 2025 | $5,933 | $114,910 | $24,500 | $90,410 |
| 2024 | $5,933 | $114,910 | $24,500 | $90,410 |
| 2023 | $5,239 | $91,157 | $14,455 | $76,702 |
| 2022 | $5,157 | $91,158 | $14,455 | $76,703 |
| 2021 | $4,313 | $91,158 | $14,455 | $76,703 |
| 2020 | $4,344 | $77,252 | $12,250 | $65,002 |
| 2019 | $4,402 | $77,252 | $12,250 | $65,002 |
| 2018 | $4,415 | $77,252 | $12,250 | $65,002 |
| 2017 | $3,883 | $60,613 | $9,776 | $50,838 |
| 2016 | $3,983 | $60,613 | $9,776 | $50,838 |
| 2015 | $3,623 | $60,613 | $9,776 | $50,838 |
| 2014 | -- | $60,610 | $9,780 | $50,840 |
| 2013 | $3,861 | $75,960 | $12,250 | $63,710 |
Source: Public Records
Map
Nearby Homes
- 8480 Island Pines Place
- 1265 Soaring Way
- 3237 S Cove Ct
- 3444 Cutter Ln
- 2847 Mossy Brink Ct
- 2859 Mossy Brink Ct
- 3222 Locust Ave
- 2898 Mossy Brink Ct Unit 19
- 3516 Cutter Ln
- 2675 Carriagegate Ln
- 8833 Dover Dr
- 2491 Old Mill Rd
- 8188 Columbia Rd
- 7740 Hackney Cir
- 7808 Meadow Crest Ct
- 8582 Southland Dr
- 7790 Strawberry Hill Ln
- 8839 Pollard Place
- 8135 Creek Woods Place
- 7846 Hackney Cir
- 3977 Sunday Ln
- 3975 Sunday Ln
- 3976 Sunday Ln
- 3980 Sunday Ln
- 3995 Sunday Ln
- 3996 Sunday Ln
- 3998 Sunday Ln
- 4024 Sunday Ln
- 4022 Sunday Ln
- 4030 Orchard Ln
- 4020 Orchard Ln
- 3979 Sunday Ln
- 4010 Orchard Ln
- 4020 Sunday Ln
- 2984 Pine Grove Ln
- 2978 Pine Grove Ln
- 2990 Pine Grove Ln
- 2972 Pine Grove Ln
- 4023 Orchard Ln
- 3006 Pine Grove Ln
Your Personal Tour Guide
Ask me questions while you tour the home.