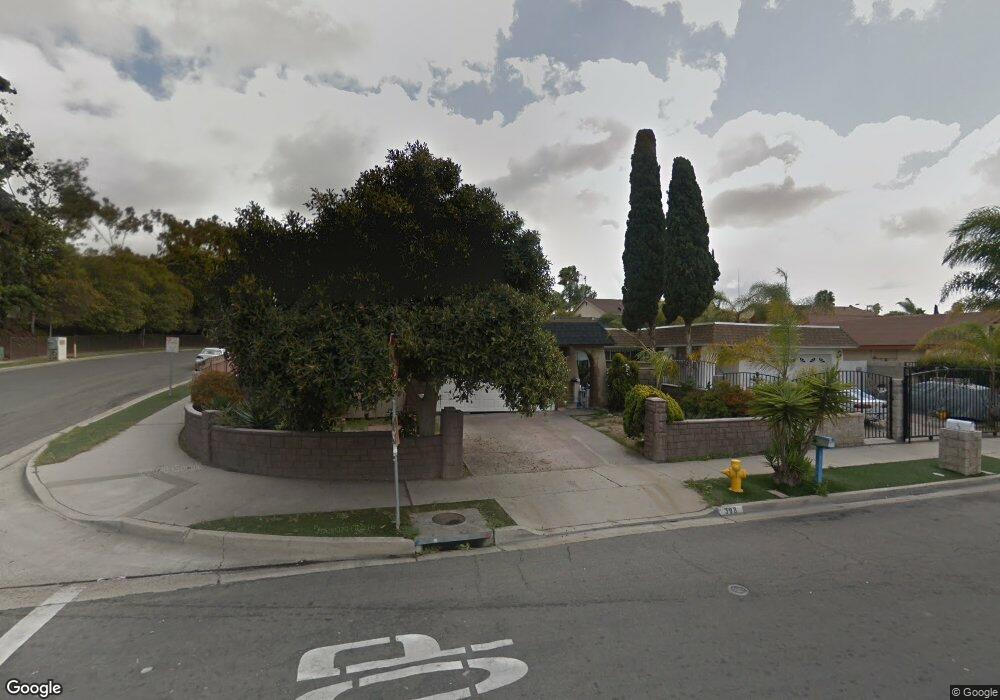
398 Calle Montecito Oceanside, CA 92057
North Valley NeighborhoodEstimated Value: $538,000 - $631,000
2
Beds
1
Bath
902
Sq Ft
$648/Sq Ft
Est. Value
About This Home
This home is located at 398 Calle Montecito, Oceanside, CA 92057 and is currently estimated at $584,548, approximately $648 per square foot. 398 Calle Montecito is a home located in San Diego County with nearby schools including Libby Elementary School, Cesar Chavez Middle School, and El Camino High School.
Ownership History
Date
Name
Owned For
Owner Type
Purchase Details
Closed on
Jul 14, 2020
Sold by
Varlie Judith M and The Marital Trust
Bought by
Pacific Rim Property Llc
Current Estimated Value
Purchase Details
Closed on
Dec 9, 1998
Sold by
Flores Jose L and Flores Judith M
Bought by
Flores Jose Luis and Flores Judith Marie
Purchase Details
Closed on
Aug 20, 1997
Sold by
Flores Kristy M
Bought by
Flores Jose
Home Financials for this Owner
Home Financials are based on the most recent Mortgage that was taken out on this home.
Original Mortgage
$38,150
Interest Rate
7.45%
Purchase Details
Closed on
Aug 19, 1997
Sold by
Federal Home Loan Mortgage Corporation
Bought by
Flores Jose and Flores Judith
Home Financials for this Owner
Home Financials are based on the most recent Mortgage that was taken out on this home.
Original Mortgage
$38,150
Interest Rate
7.45%
Purchase Details
Closed on
Jan 14, 1997
Sold by
American Svgs Bank Fa
Bought by
Federal Home Loan Mortgage Corporation
Purchase Details
Closed on
Jan 22, 1990
Purchase Details
Closed on
Apr 2, 1986
Create a Home Valuation Report for This Property
The Home Valuation Report is an in-depth analysis detailing your home's value as well as a comparison with similar homes in the area
Home Values in the Area
Average Home Value in this Area
Purchase History
| Date | Buyer | Sale Price | Title Company |
|---|---|---|---|
| Pacific Rim Property Llc | -- | None Available | |
| Varlie Judith M | -- | None Available | |
| Flores Joe L | -- | None Available | |
| Flores Jose Luis | -- | -- | |
| Flores Jose | -- | -- | |
| Flores Jose | -- | Fidelity National Title | |
| Flores Jose | $45,000 | Fidelity National Title | |
| Federal Home Loan Mortgage Corporation | -- | Chicago Title | |
| American Svgs Bank Fa | $58,000 | Chicago Title | |
| -- | $88,500 | -- | |
| -- | $62,300 | -- |
Source: Public Records
Mortgage History
| Date | Status | Borrower | Loan Amount |
|---|---|---|---|
| Previous Owner | Flores Jose | $38,150 |
Source: Public Records
Tax History
| Year | Tax Paid | Tax Assessment Tax Assessment Total Assessment is a certain percentage of the fair market value that is determined by local assessors to be the total taxable value of land and additions on the property. | Land | Improvement |
|---|---|---|---|---|
| 2025 | $4,916 | $443,795 | $335,553 | $108,242 |
| 2024 | $4,916 | $435,094 | $328,974 | $106,120 |
| 2023 | $4,650 | $416,160 | $322,524 | $93,636 |
| 2022 | $4,580 | $408,000 | $316,200 | $91,800 |
| 2021 | $802 | $66,210 | $29,493 | $36,717 |
| 2020 | $778 | $65,532 | $29,191 | $36,341 |
| 2019 | $757 | $64,248 | $28,619 | $35,629 |
| 2018 | $749 | $62,989 | $28,058 | $34,931 |
| 2017 | $70 | $61,755 | $27,508 | $34,247 |
| 2016 | $711 | $60,545 | $26,969 | $33,576 |
| 2015 | $691 | $59,636 | $26,564 | $33,072 |
| 2014 | $667 | $58,469 | $26,044 | $32,425 |
Source: Public Records
Map
Nearby Homes
- 0 N River Rd Unit NDP2507519
- 4660 N River Rd Unit 150
- 4660 N River Rd Unit 116
- 4660 N River Rd Unit 136
- 4660 N River Rd Unit 17
- 514 Calle Montecito Unit 78
- 514 Calle Montecito Unit 80
- 517 Calle Montecito Unit 91
- 510 Calle Montecito Unit 51
- 518 Calle Montecito Unit 95
- 4832 Tacayme Dr
- 4616 N River Rd Unit 89
- 267 Fortunada St
- 231 Riverview Way
- 265 Securidad St
- 4901 Siesta Dr
- 436 W Redondo Dr
- 4745 Marblehead Bay Dr
- 4924 Verde Dr
- 4918 Roja Dr
- 394 Calle Montecito
- 399 Calle Mariposa
- 390 Calle Montecito
- 395 Calle Mariposa
- 391 Calle Mariposa
- 386 Calle Montecito
- 387 Calle Mariposa
- 397 Calle Montecito
- 384 Calle Montecito
- 395 Calle Montecito
- 385 Calle Mariposa
- 401 Calle Montecito
- 391 Calle Montecito
- 405 Calle Montecito
- 387 Calle Montecito
- 380 Calle Montecito
- 4741 Calle Las Positas
- 381 Calle Mariposa
- 383 Calle Montecito
- 409 Calle Montecito
Your Personal Tour Guide
Ask me questions while you tour the home.