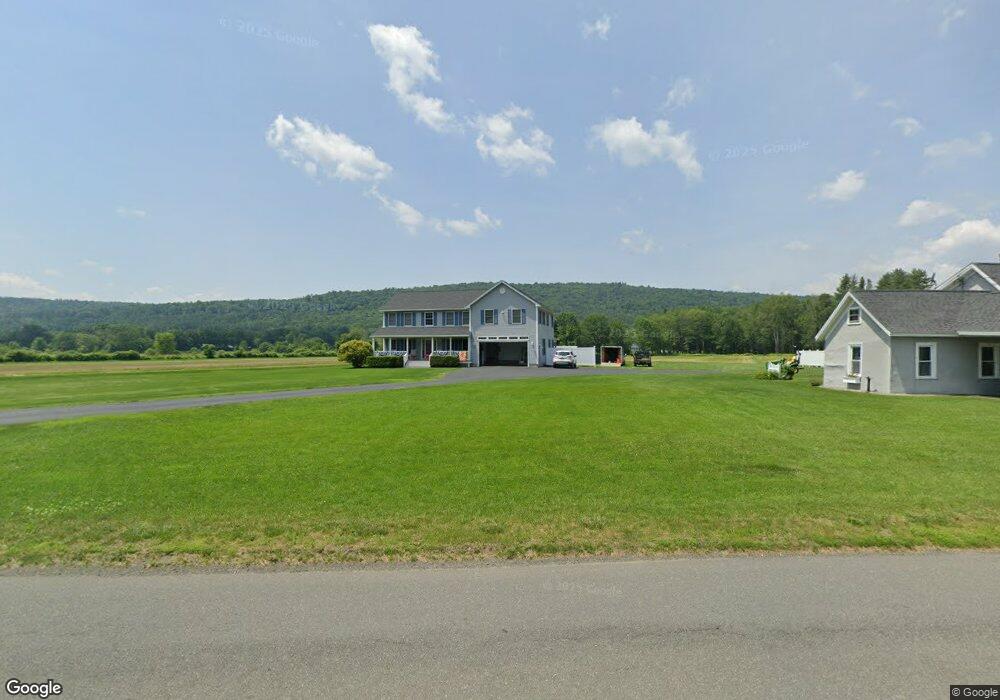
398 Colrain Rd Greenfield, MA 01301
Estimated Value: $668,435 - $709,000
4
Beds
3
Baths
3,535
Sq Ft
$194/Sq Ft
Est. Value
About This Home
This home is located at 398 Colrain Rd, Greenfield, MA 01301 and is currently estimated at $685,478, approximately $193 per square foot. 398 Colrain Rd is a home located in Franklin County with nearby schools including Four Rivers Charter Public School and Cornerstone Christian School.
Ownership History
Date
Name
Owned For
Owner Type
Purchase Details
Closed on
Sep 21, 2020
Sold by
400-404 Colrain Road Rt
Bought by
Osullivan Sean M and Osullivan Kathleen M
Current Estimated Value
Purchase Details
Closed on
Oct 2, 2014
Sold by
Osullivan Sandra R
Bought by
Osullivan Sean M and Osullivan Kathleen M
Create a Home Valuation Report for This Property
The Home Valuation Report is an in-depth analysis detailing your home's value as well as a comparison with similar homes in the area
Home Values in the Area
Average Home Value in this Area
Purchase History
| Date | Buyer | Sale Price | Title Company |
|---|---|---|---|
| Osullivan Sean M | -- | None Available | |
| Osullivan Sean M | -- | None Available | |
| Czuj Mark E | -- | None Available | |
| Czuj Mark E | -- | None Available | |
| Osullivan Sean M | -- | None Available | |
| Osullivan Sean M | -- | None Available | |
| Osullivan Sean M | $10,000 | -- | |
| Osullivan Sean M | $10,000 | -- |
Source: Public Records
Mortgage History
| Date | Status | Borrower | Loan Amount |
|---|---|---|---|
| Previous Owner | Osullivan Sean M | $320,000 | |
| Previous Owner | Osullivan Sean M | $337,000 | |
| Previous Owner | Osullivan Sean M | $200,000 |
Source: Public Records
Tax History Compared to Growth
Tax History
| Year | Tax Paid | Tax Assessment Tax Assessment Total Assessment is a certain percentage of the fair market value that is determined by local assessors to be the total taxable value of land and additions on the property. | Land | Improvement |
|---|---|---|---|---|
| 2025 | $11,806 | $603,600 | $101,300 | $502,300 |
| 2024 | $12,650 | $620,400 | $114,900 | $505,500 |
| 2023 | $11,578 | $589,200 | $114,900 | $474,300 |
| 2022 | $11,260 | $504,500 | $110,500 | $394,000 |
| 2021 | $10,458 | $450,400 | $103,500 | $346,900 |
| 2020 | $10,091 | $440,100 | $103,500 | $336,600 |
| 2019 | $9,675 | $432,700 | $93,900 | $338,800 |
| 2018 | $9,627 | $429,200 | $92,700 | $336,500 |
| 2017 | $10,196 | $469,200 | $92,700 | $376,500 |
| 2016 | $10,351 | $474,600 | $92,700 | $381,900 |
| 2015 | $10,235 | $454,700 | $94,300 | $360,400 |
| 2014 | $8,715 | $424,500 | $66,500 | $358,000 |
Source: Public Records
Map
Nearby Homes