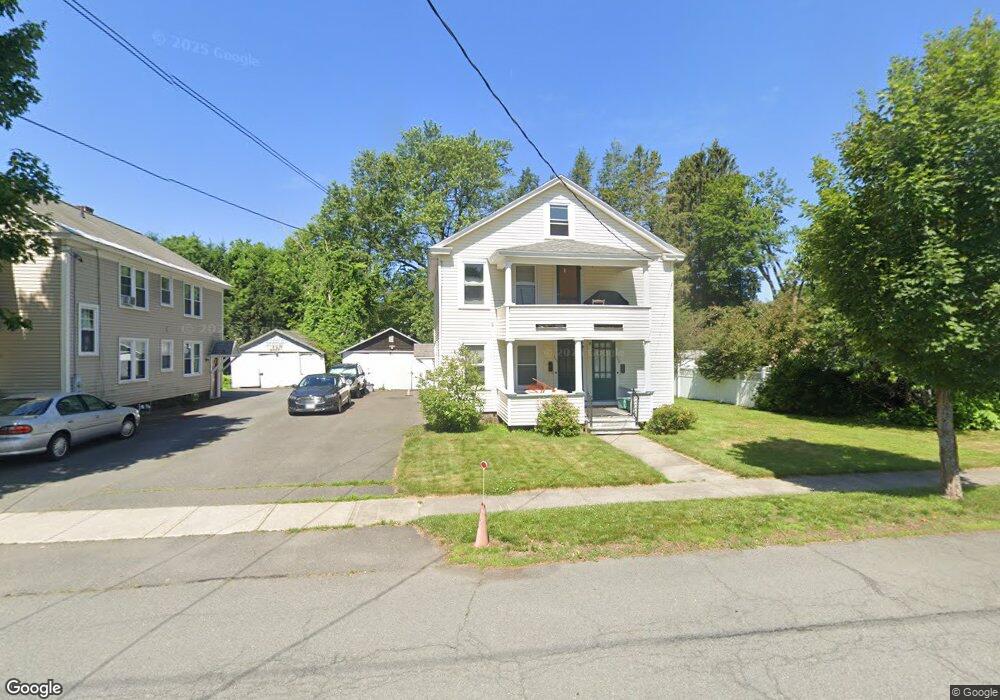
398 Davis St Unit 400 Greenfield, MA 01301
Estimated Value: $235,000 - $282,985
2
Beds
2
Baths
1,664
Sq Ft
$155/Sq Ft
Est. Value
About This Home
This home is located at 398 Davis St Unit 400, Greenfield, MA 01301 and is currently estimated at $258,746, approximately $155 per square foot. 398 Davis St Unit 400 is a home located in Franklin County with nearby schools including Cornerstone Christian School and Holy Trinity School.
Ownership History
Date
Name
Owned For
Owner Type
Purchase Details
Closed on
Jul 17, 2000
Sold by
Yarrows Leonard A and Yarrows Mary L
Bought by
Brown Joann M
Current Estimated Value
Home Financials for this Owner
Home Financials are based on the most recent Mortgage that was taken out on this home.
Original Mortgage
$80,675
Interest Rate
8.5%
Mortgage Type
Purchase Money Mortgage
Purchase Details
Closed on
Aug 16, 1988
Sold by
Greene Gary A
Bought by
Harrows Leonard
Create a Home Valuation Report for This Property
The Home Valuation Report is an in-depth analysis detailing your home's value as well as a comparison with similar homes in the area
Home Values in the Area
Average Home Value in this Area
Purchase History
| Date | Buyer | Sale Price | Title Company |
|---|---|---|---|
| Brown Joann M | $90,675 | -- | |
| Brown Joann M | $90,675 | -- | |
| Harrows Leonard | $117,000 | -- |
Source: Public Records
Mortgage History
| Date | Status | Borrower | Loan Amount |
|---|---|---|---|
| Open | Harrows Leonard | $104,750 | |
| Closed | Harrows Leonard | $77,500 | |
| Closed | Harrows Leonard | $80,675 |
Source: Public Records
Tax History Compared to Growth
Tax History
| Year | Tax Paid | Tax Assessment Tax Assessment Total Assessment is a certain percentage of the fair market value that is determined by local assessors to be the total taxable value of land and additions on the property. | Land | Improvement |
|---|---|---|---|---|
| 2025 | $3,783 | $193,400 | $68,400 | $125,000 |
| 2024 | $3,674 | $180,200 | $56,300 | $123,900 |
| 2023 | $3,529 | $178,800 | $56,300 | $122,500 |
| 2022 | $3,506 | $157,100 | $53,700 | $103,400 |
| 2021 | $3,648 | $157,100 | $53,700 | $103,400 |
| 2020 | $3,602 | $157,100 | $53,700 | $103,400 |
| 2019 | $3,354 | $150,000 | $46,600 | $103,400 |
| 2018 | $3,293 | $146,800 | $45,600 | $101,200 |
| 2017 | $3,190 | $146,800 | $45,600 | $101,200 |
| 2016 | $3,176 | $145,600 | $48,300 | $97,300 |
| 2015 | $3,264 | $145,000 | $48,300 | $96,700 |
| 2014 | $2,979 | $145,100 | $48,300 | $96,800 |
Source: Public Records
Map
Nearby Homes