M
Seller's Agent in 2015
Mary Gill
The Realty Group
(770) 480-8222
99 Total Sales
Estimated Value: $135,000 - $273,000
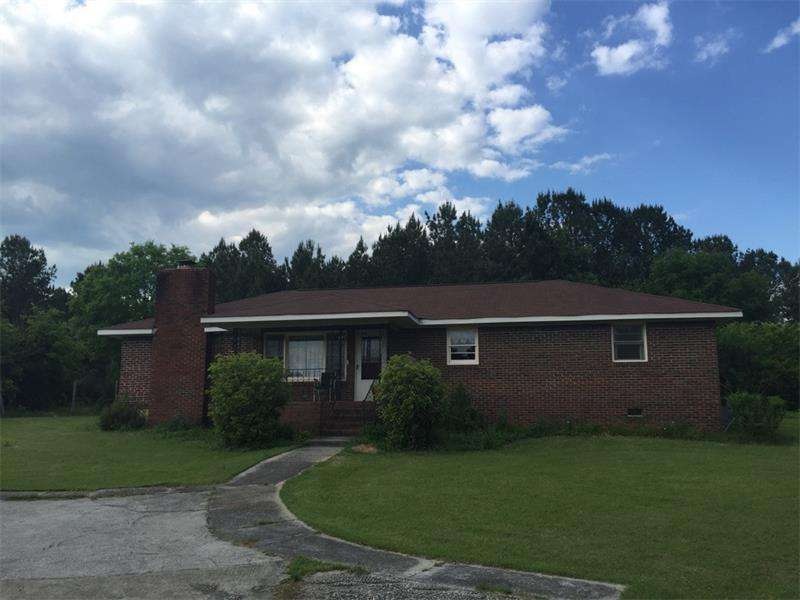
On amazing piece of land, this property will not last long!
Last Buyer's Agent
NON-MLS NMLS
Non FMLS Member
| Date | Buyer | Sale Price | Title Company |
|---|---|---|---|
| Brown Kristopher William | $75,000 | -- | |
| Murray Rebecca J | -- | -- | |
| Johnson Robert H | $92,000 | -- | |
| Bost Donald Edwin | -- | -- |
| Date | Status | Borrower | Loan Amount |
|---|---|---|---|
| Open | Brown Kristopher William | $76,530 |
| Date | Event | Price | List to Sale | Price per Sq Ft |
|---|---|---|---|---|
| 08/28/2015 08/28/15 | Sold | $75,000 | -- | $54 / Sq Ft |
| 06/17/2015 06/17/15 | Pending | -- | -- | -- |
| Year | Tax Paid | Tax Assessment Tax Assessment Total Assessment is a certain percentage of the fair market value that is determined by local assessors to be the total taxable value of land and additions on the property. | Land | Improvement |
|---|---|---|---|---|
| 2024 | $1,105 | $54,797 | $5,640 | $49,157 |
| 2023 | $980 | $46,950 | $4,700 | $42,250 |
| 2022 | $919 | $44,005 | $2,910 | $41,095 |
| 2021 | $702 | $31,940 | $2,910 | $29,030 |
| 2020 | $696 | $31,380 | $2,910 | $28,470 |
| 2019 | $697 | $31,380 | $2,910 | $28,470 |
| 2018 | $710 | $31,380 | $2,910 | $28,470 |
| 2017 | $679 | $30,059 | $2,909 | $27,150 |
| 2016 | $677 | $30,059 | $2,909 | $27,150 |
| 2015 | -- | $29,235 | $5,200 | $24,035 |
| 2014 | -- | $29,258 | $5,200 | $24,058 |
| 2013 | -- | $34,645 | $5,200 | $29,445 |
M
Seller's Agent in 2015
Mary Gill
The Realty Group
(770) 480-8222
99 Total Sales
N
Buyer's Agent in 2015
NON-MLS NMLS
Non FMLS Member
Source: First Multiple Listing Service (FMLS)
MLS Number: 5546389
APN: 0038-0084
![]() Listings identified with the FMLS IDX logo come from FMLS and are held by brokerage firms other than the owner of this website. The listing brokerage is identified in any listing details. Information is deemed reliable but is not guaranteed. If you believe any FMLS listing contains material that infringes your copyrighted work please visit www.fmls.com/dmca to review our DMCA policy and learn how to submit a takedown request. © 2026 First Multiple Listing Service, Inc.
Listings identified with the FMLS IDX logo come from FMLS and are held by brokerage firms other than the owner of this website. The listing brokerage is identified in any listing details. Information is deemed reliable but is not guaranteed. If you believe any FMLS listing contains material that infringes your copyrighted work please visit www.fmls.com/dmca to review our DMCA policy and learn how to submit a takedown request. © 2026 First Multiple Listing Service, Inc.
Disclaimer: Certain information contained herein is derived from information provided by parties other than Homes.com. All information provided is deemed reliable, but is not guaranteed to be accurate and should be independently verified.
Ask me questions while you tour the home.
