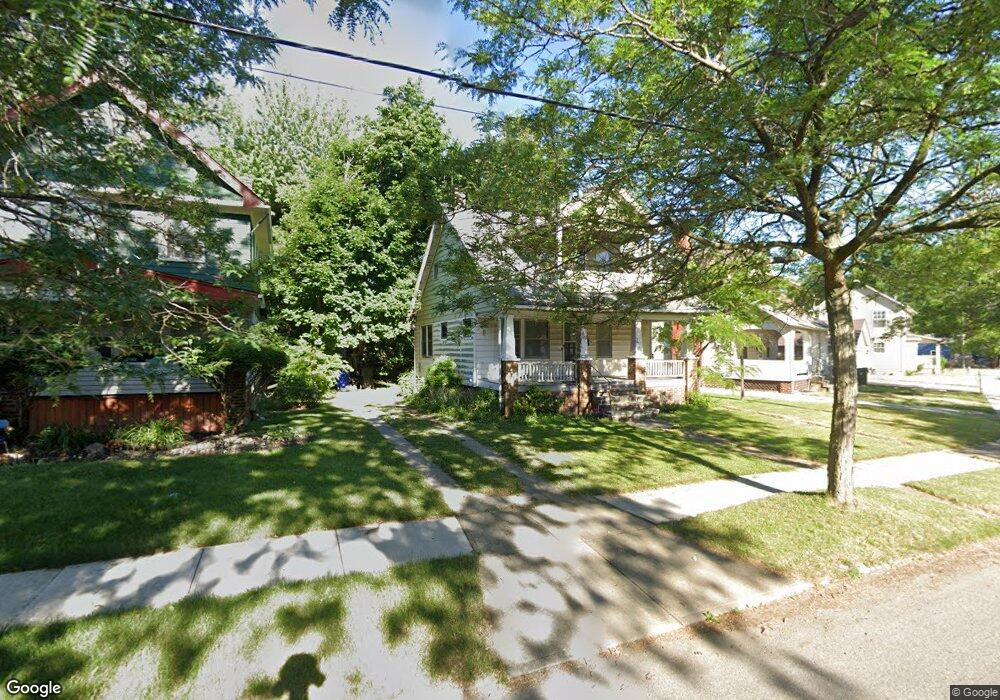
398 E 146th St Cleveland, OH 44110
North Collinwood NeighborhoodEstimated Value: $66,872 - $102,000
2
Beds
1
Bath
1,092
Sq Ft
$77/Sq Ft
Est. Value
About This Home
This home is located at 398 E 146th St, Cleveland, OH 44110 and is currently estimated at $84,218, approximately $77 per square foot. 398 E 146th St is a home located in Cuyahoga County with nearby schools including Bolton, Anton Grdina School, and Adlai Stevenson School.
Ownership History
Date
Name
Owned For
Owner Type
Purchase Details
Closed on
Feb 13, 2000
Sold by
Williams Randall E and Jayne Mary
Bought by
Allen Christopher J
Current Estimated Value
Home Financials for this Owner
Home Financials are based on the most recent Mortgage that was taken out on this home.
Original Mortgage
$39,300
Outstanding Balance
$12,992
Interest Rate
8.16%
Estimated Equity
$71,226
Purchase Details
Closed on
Jun 3, 1999
Sold by
Williams Randall E
Bought by
Williams Randall E and Williams Mary Jayne
Purchase Details
Closed on
Nov 20, 1986
Sold by
Marks Minnie
Bought by
Williams Randall E
Purchase Details
Closed on
Aug 1, 1984
Sold by
Lyle Marks
Bought by
Marks Minnie
Purchase Details
Closed on
Aug 21, 1979
Sold by
Marks Lyle
Bought by
Lyle Marks
Purchase Details
Closed on
Aug 25, 1978
Sold by
Marks Minnie and Marks Dale
Bought by
Marks Lyle
Purchase Details
Closed on
Oct 8, 1975
Sold by
Hutchens Dale Martin
Bought by
Marks Minnie and Marks Dale
Purchase Details
Closed on
Jan 1, 1975
Bought by
Hutchens Dale Martin
Create a Home Valuation Report for This Property
The Home Valuation Report is an in-depth analysis detailing your home's value as well as a comparison with similar homes in the area
Home Values in the Area
Average Home Value in this Area
Purchase History
| Date | Buyer | Sale Price | Title Company |
|---|---|---|---|
| Allen Christopher J | $43,700 | -- | |
| Williams Randall E | -- | -- | |
| Williams Randall E | $30,000 | -- | |
| Marks Minnie | -- | -- | |
| Lyle Marks | -- | -- | |
| Marks Lyle | -- | -- | |
| Marks Minnie | $12,500 | -- | |
| Hutchens Dale Martin | -- | -- |
Source: Public Records
Mortgage History
| Date | Status | Borrower | Loan Amount |
|---|---|---|---|
| Open | Allen Christopher J | $39,300 |
Source: Public Records
Tax History Compared to Growth
Tax History
| Year | Tax Paid | Tax Assessment Tax Assessment Total Assessment is a certain percentage of the fair market value that is determined by local assessors to be the total taxable value of land and additions on the property. | Land | Improvement |
|---|---|---|---|---|
| 2024 | $1,018 | $15,225 | $5,705 | $9,520 |
| 2023 | $589 | $7,600 | $2,000 | $5,600 |
| 2022 | $586 | $7,600 | $2,000 | $5,600 |
| 2021 | $580 | $7,600 | $2,000 | $5,600 |
| 2020 | $587 | $6,650 | $1,750 | $4,900 |
| 2019 | $544 | $19,000 | $5,000 | $14,000 |
| 2018 | $542 | $6,650 | $1,750 | $4,900 |
| 2017 | $870 | $10,290 | $1,820 | $8,470 |
| 2016 | $863 | $10,290 | $1,820 | $8,470 |
| 2015 | $996 | $10,290 | $1,820 | $8,470 |
| 2014 | $996 | $11,830 | $2,100 | $9,730 |
Source: Public Records
Map
Nearby Homes
- 412 E 146th St
- 457 E 143rd St
- 14602 Lakeshore Blvd
- 472 E 147th St
- 323 Groveland Club Dr
- 14509 Westropp Ave
- 317 Groveland Club Dr
- 14613 Westropp Ave
- 481 E 147th St
- 482 E 142nd St
- 14405 Hale Ave
- 472 E 149th St
- 497 E 149th St
- 325 Overlook Park Dr
- 505 E 149th St
- 14106 Sylvia Ave
- 14014 Sylvia Ave
- 15218 Shiloh Rd
- 14716 Thames Ave
- 15223 Macauley Ave
- 400 E 146th St
- 392 E 146th St
- 406 E 146th St
- 14502 Lake Shore Blvd
- 14410 Lake Shore Blvd
- 14506 Lake Shore Blvd
- 14508 Lake Shore Blvd
- 14501 Esmeralda Ave
- 414 E 146th St
- 403 E 146th St
- 399 E 146th St
- 395 E 146th St
- 14413 Esmeralda Ave
- 14505 Esmeralda Ave
- 14408 Lake Shore Blvd
- 407 E 146th St
- 14602 Lakeshore Blvd Unit 4
- 14602 Lakeshore Blvd Unit 1
- 14409 Esmeralda Ave
- 391 E 146th St