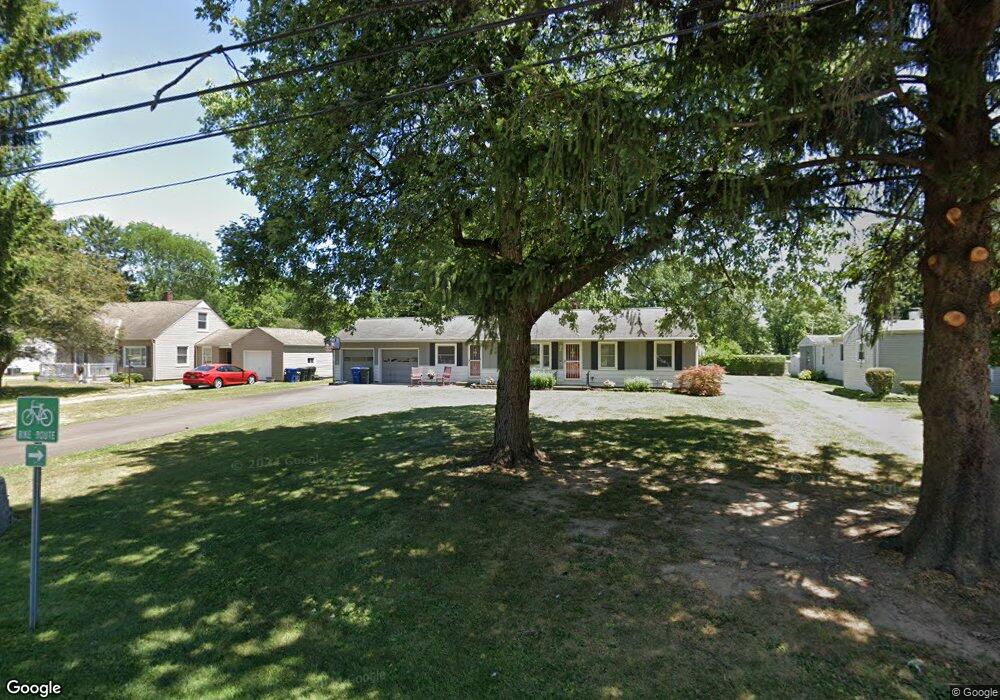
398 James Rd Columbus, OH 43230
Gahanna-Havens Corners NeighborhoodEstimated Value: $209,000 - $283,000
3
Beds
2
Baths
1,127
Sq Ft
$223/Sq Ft
Est. Value
About This Home
This home is located at 398 James Rd, Columbus, OH 43230 and is currently estimated at $251,356, approximately $223 per square foot. 398 James Rd is a home located in Franklin County with nearby schools including Goshen Lane Elementary School, Gahanna West Middle School, and Lincoln High School.
Ownership History
Date
Name
Owned For
Owner Type
Purchase Details
Closed on
Dec 30, 2010
Sold by
Wolfe Mary K and Selvey Patricia A
Bought by
Swinney E Kevin and Swinney Lucinda
Current Estimated Value
Home Financials for this Owner
Home Financials are based on the most recent Mortgage that was taken out on this home.
Original Mortgage
$99,600
Outstanding Balance
$66,834
Interest Rate
4.53%
Mortgage Type
New Conventional
Estimated Equity
$184,522
Purchase Details
Closed on
Dec 24, 2010
Sold by
Carr James and Carr Dayna
Bought by
Swinney E Kevin and Swinney Lucinda
Home Financials for this Owner
Home Financials are based on the most recent Mortgage that was taken out on this home.
Original Mortgage
$99,600
Outstanding Balance
$66,834
Interest Rate
4.53%
Mortgage Type
New Conventional
Estimated Equity
$184,522
Purchase Details
Closed on
Jul 31, 2000
Sold by
Carr Violet M and Carr Violet Marie
Bought by
Carr George E J and Carr Violet M
Create a Home Valuation Report for This Property
The Home Valuation Report is an in-depth analysis detailing your home's value as well as a comparison with similar homes in the area
Home Values in the Area
Average Home Value in this Area
Purchase History
| Date | Buyer | Sale Price | Title Company |
|---|---|---|---|
| Swinney E Kevin | $62,200 | Gahanna | |
| Swinney E Kevin | $62,300 | Gahanna | |
| Carr George E J | -- | -- |
Source: Public Records
Mortgage History
| Date | Status | Borrower | Loan Amount |
|---|---|---|---|
| Open | Swinney E Kevin | $99,600 |
Source: Public Records
Tax History Compared to Growth
Tax History
| Year | Tax Paid | Tax Assessment Tax Assessment Total Assessment is a certain percentage of the fair market value that is determined by local assessors to be the total taxable value of land and additions on the property. | Land | Improvement |
|---|---|---|---|---|
| 2024 | $4,461 | $65,140 | $13,130 | $52,010 |
| 2023 | $4,413 | $65,135 | $13,125 | $52,010 |
| 2022 | $5,514 | $65,490 | $11,030 | $54,460 |
| 2021 | $5,353 | $65,490 | $11,030 | $54,460 |
| 2020 | $5,314 | $65,490 | $11,030 | $54,460 |
| 2019 | $4,543 | $54,610 | $9,210 | $45,400 |
| 2018 | $3,921 | $54,610 | $9,210 | $45,400 |
| 2017 | $2,860 | $43,410 | $9,210 | $34,200 |
| 2016 | $3,947 | $54,570 | $22,330 | $32,240 |
| 2015 | $3,950 | $54,570 | $22,330 | $32,240 |
| 2014 | $3,920 | $54,570 | $22,330 | $32,240 |
| 2013 | $1,946 | $54,565 | $22,330 | $32,235 |
Source: Public Records
Map
Nearby Homes
- 390 Dunbarton Rd
- 407 Denison Ave
- 183 Serran Dr
- 198 Gary Lee Dr
- 206 Lintner St
- 600 Agler Rd
- 219 N Hamilton Rd
- 603 Fawndale Place
- 278 Empire Dr
- 0 Mifflin Blvd
- 379 Heil Dr
- 0 E Emmons Ave
- 343 Imperial Dr
- 2876 Johnstown Rd
- 404 Foxwood Dr
- 373 Lyncroft Dr
- 0 E Minnesota Ave Unit 224018641
- 221 Lincolnshire Rd
- 311 N Hamilton Rd
- 305 Caro Ln