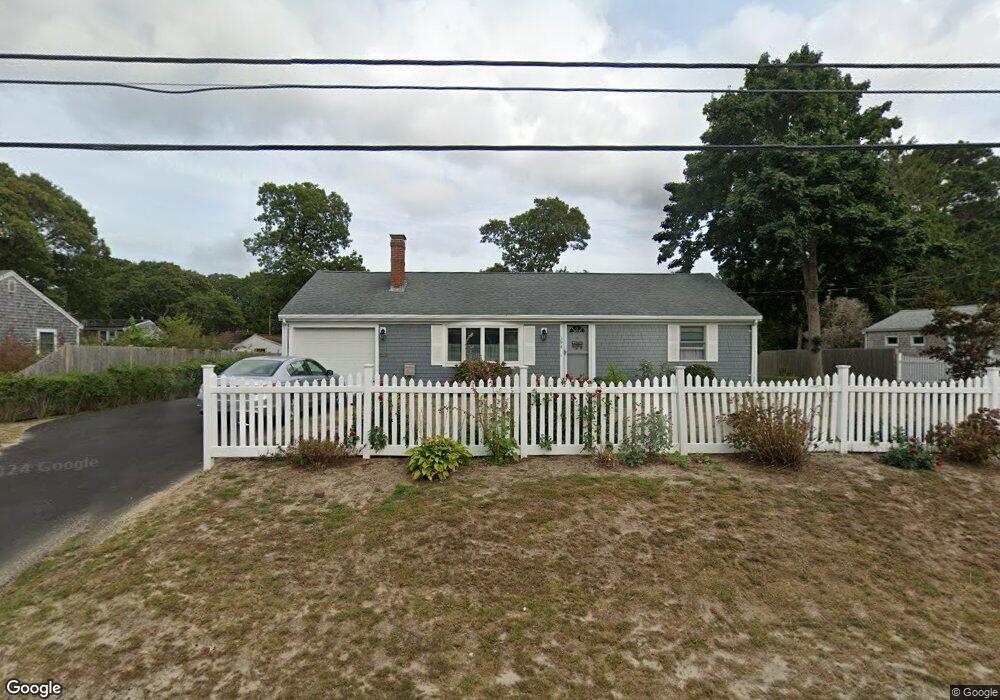
398 N Main St South Yarmouth, MA 02664
Estimated Value: $461,000 - $555,000
2
Beds
1
Bath
960
Sq Ft
$535/Sq Ft
Est. Value
About This Home
This home is located at 398 N Main St, South Yarmouth, MA 02664 and is currently estimated at $513,955, approximately $535 per square foot. 398 N Main St is a home located in Barnstable County with nearby schools including Dennis-Yarmouth Regional High School and St. Pius X. School.
Ownership History
Date
Name
Owned For
Owner Type
Purchase Details
Closed on
Aug 25, 2022
Sold by
Savage Helga U
Bought by
Helga U Savage Lt
Current Estimated Value
Purchase Details
Closed on
Oct 11, 1974
Bought by
Savage Helga U
Create a Home Valuation Report for This Property
The Home Valuation Report is an in-depth analysis detailing your home's value as well as a comparison with similar homes in the area
Home Values in the Area
Average Home Value in this Area
Purchase History
| Date | Buyer | Sale Price | Title Company |
|---|---|---|---|
| Helga U Savage Lt | -- | None Available | |
| Savage Helga U | -- | -- |
Source: Public Records
Tax History Compared to Growth
Tax History
| Year | Tax Paid | Tax Assessment Tax Assessment Total Assessment is a certain percentage of the fair market value that is determined by local assessors to be the total taxable value of land and additions on the property. | Land | Improvement |
|---|---|---|---|---|
| 2025 | $3,005 | $424,400 | $173,900 | $250,500 |
| 2024 | $2,813 | $381,200 | $151,300 | $229,900 |
| 2023 | $2,713 | $334,500 | $131,000 | $203,500 |
| 2022 | $2,575 | $280,500 | $119,000 | $161,500 |
| 2021 | $2,443 | $255,500 | $119,000 | $136,500 |
| 2020 | $2,405 | $240,500 | $119,000 | $121,500 |
| 2019 | $2,247 | $222,500 | $119,000 | $103,500 |
| 2018 | $2,108 | $204,900 | $101,400 | $103,500 |
| 2017 | $2,009 | $200,500 | $97,000 | $103,500 |
| 2016 | $1,913 | $191,700 | $88,200 | $103,500 |
| 2015 | $1,815 | $180,800 | $88,200 | $92,600 |
Source: Public Records
Map
Nearby Homes
- 91 Chipping Green Cir
- 85 Keel Cape Dr
- 37 Winsome Rd
- 8 Viking Rock Rd
- 30 Pebble Beach Way
- 21 Green Way
- 140 Diane Ave
- 23 Fairwood Rd
- 38 N Dennis Rd
- 1 Country Club Dr
- 18 Curve Hill Rd
- 176 Beacon St
- 4 Old Colony Way
- 2 Buttercup Ln
- 4 Raymond Ave
- 129 Driftwood Ln
- 17 Fairmount Rd
- 17 Fairmount Rd
- 32 Half Way
- 402 N Main St
- 392 N Main St
- 29-31 Melville Rd
- 29 Melville Rd Unit 31
- 35 Melville Rd
- 29 Melville Rd Unit 29 & 31
- 399 N Main St
- 27 Melville Rd
- 41 Melville Rd
- 0 Melville Rd Unit 9905662
- 0 Melville Rd Unit 46-4 2025579
- 0 Melville Rd Unit A 5013887
- 0 Melville Rd Unit 4A-4
- 408 N Main St
- 388-390 N Main St
- 388 N Main St Unit 390
- 397 N Main St
- 36 Melville Rd
- 21 Melville Rd
- 30 Melville Rd