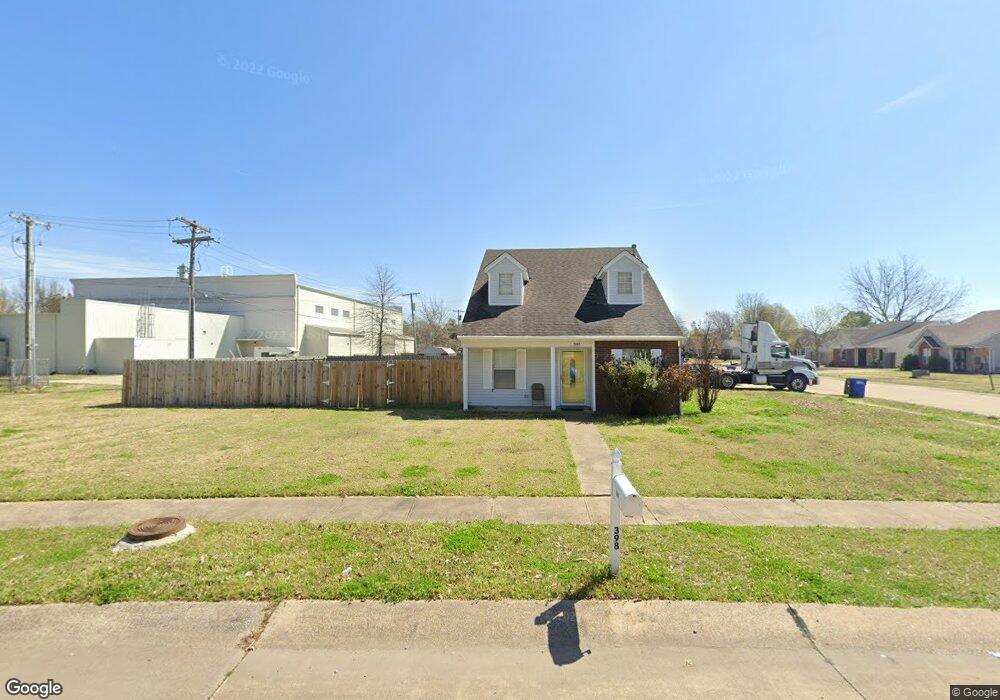
398 Oak Creek Rd West Memphis, AR 72301
Estimated Value: $137,000 - $168,000
3
Beds
2
Baths
1,153
Sq Ft
$133/Sq Ft
Est. Value
About This Home
This home is located at 398 Oak Creek Rd, West Memphis, AR 72301 and is currently estimated at $153,769, approximately $133 per square foot. 398 Oak Creek Rd is a home located in Crittenden County with nearby schools including Faulk Elementary School, Wonder Junior High School, and The Academies of West Memphis Charter School.
Ownership History
Date
Name
Owned For
Owner Type
Purchase Details
Closed on
Jun 30, 2017
Sold by
Sharp Badgett Kayla J and Badgett Tanner
Bought by
Bryant Conneshia
Current Estimated Value
Home Financials for this Owner
Home Financials are based on the most recent Mortgage that was taken out on this home.
Original Mortgage
$93,180
Outstanding Balance
$78,171
Interest Rate
4.25%
Mortgage Type
FHA
Estimated Equity
$75,598
Purchase Details
Closed on
Jul 25, 2014
Bought by
Sharp Kayla J
Purchase Details
Closed on
Sep 15, 2009
Sold by
Elliot Julius E
Bought by
Shepherd Joshua R
Home Financials for this Owner
Home Financials are based on the most recent Mortgage that was taken out on this home.
Original Mortgage
$78,551
Interest Rate
5.12%
Mortgage Type
Unknown
Purchase Details
Closed on
Dec 8, 1997
Sold by
Not Provided
Bought by
Elliott Julius E and Elliott Lynda A
Purchase Details
Closed on
Aug 1, 1989
Bought by
To
Purchase Details
Closed on
Apr 1, 1989
Bought by
To
Create a Home Valuation Report for This Property
The Home Valuation Report is an in-depth analysis detailing your home's value as well as a comparison with similar homes in the area
Home Values in the Area
Average Home Value in this Area
Purchase History
| Date | Buyer | Sale Price | Title Company |
|---|---|---|---|
| Bryant Conneshia | $94,900 | Stewart Title | |
| Sharp Kayla J | $90,000 | -- | |
| Shepherd Joshua R | -- | -- | |
| Elliott Julius E | $64,012 | -- | |
| To | $56,000 | -- | |
| To | $9,000 | -- |
Source: Public Records
Mortgage History
| Date | Status | Borrower | Loan Amount |
|---|---|---|---|
| Open | Bryant Conneshia | $93,180 | |
| Previous Owner | Shepherd Joshua R | $78,551 |
Source: Public Records
Tax History Compared to Growth
Tax History
| Year | Tax Paid | Tax Assessment Tax Assessment Total Assessment is a certain percentage of the fair market value that is determined by local assessors to be the total taxable value of land and additions on the property. | Land | Improvement |
|---|---|---|---|---|
| 2024 | $267 | $15,900 | $2,800 | $13,100 |
| 2023 | $342 | $15,900 | $2,800 | $13,100 |
| 2022 | $392 | $15,900 | $2,800 | $13,100 |
| 2021 | $392 | $15,900 | $2,800 | $13,100 |
| 2020 | $720 | $15,900 | $2,800 | $13,100 |
| 2019 | $620 | $16,400 | $2,800 | $13,600 |
| 2018 | $318 | $16,400 | $2,800 | $13,600 |
| 2017 | $668 | $16,400 | $2,800 | $13,600 |
| 2016 | $626 | $16,400 | $2,800 | $13,600 |
| 2015 | $674 | $16,400 | $2,800 | $13,600 |
| 2014 | $302 | $15,860 | $2,800 | $13,060 |
Source: Public Records
Map
Nearby Homes
- 1705 Eagle Dr
- 101 Country Club Rd
- 1503 Oaklawn Dr
- 402 Brentwood Dr
- 408 Brentwood Dr
- 1504 W Barton Ave
- 1500 W Barton Ave
- 302 Georgetown Dr
- 1106 W Barton Ave
- 1709 Pine Ridge Dr
- 765 Dogwood Cove
- 1302 Windover Ln
- 1002 Clement Rd
- 732 Belmont Dr
- 909 Rosewood Dr
- 1409 Ashwood Cir
- 1012 Clement Rd
- 1042 W Roselawn Dr
- 1108 Richland Cove
- 807 W Barton Ave
- 2195 Magnolia Bend
- 2201 Oak Creek Rd
- 2206 Oak Creek Rd
- 2193 Magnolia Bend
- 399 Oak Creek Rd
- 2203 Oak Creek Rd
- 2196 Magnolia Bend
- 2191 Magnolia Bend
- 400 Oak Creek Rd
- 401 Oak Creek Rd
- 2194 Magnolia Bend
- 2205 Oak Creek Rd
- 402 Oak Creek Rd
- 403 Oak Creek Rd
- 2189 Magnolia Bend
- 2208 Oak Creek Rd
- 2192 Magnolia Bend
- 2207 Oak Creek Rd
- 405 Oak Creek Rd
- 404 Oak Creek Rd