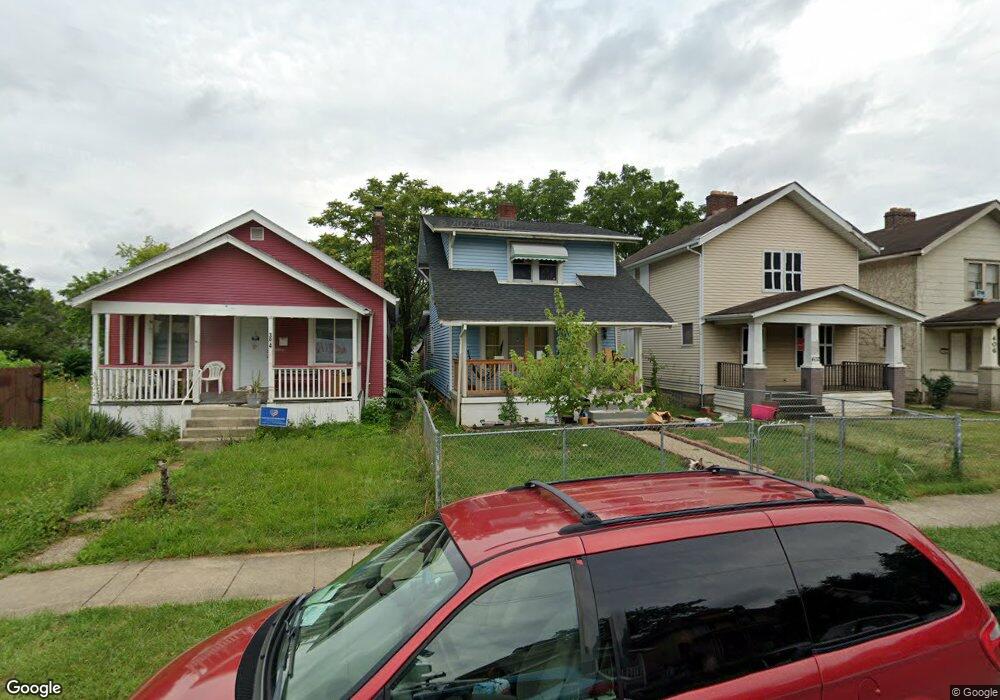
398 S Richardson Ave Columbus, OH 43204
Central Hilltop NeighborhoodEstimated Value: $85,000 - $175,000
4
Beds
2
Baths
1,116
Sq Ft
$116/Sq Ft
Est. Value
About This Home
This home is located at 398 S Richardson Ave, Columbus, OH 43204 and is currently estimated at $129,250, approximately $115 per square foot. 398 S Richardson Ave is a home located in Franklin County with nearby schools including Burroughs Elementary School, Hilltonia Middle School, and Briggs High School.
Ownership History
Date
Name
Owned For
Owner Type
Purchase Details
Closed on
Jun 24, 2020
Sold by
Florida Coastal Partners Llc
Bought by
Torres Sanjuanita
Current Estimated Value
Purchase Details
Closed on
Feb 22, 2018
Sold by
Greg O Loughlin
Bought by
Florida Costal Partners Llc
Purchase Details
Closed on
Feb 11, 2011
Sold by
Bradshaw Michael and Dorsey Alex
Bought by
Oloughlin Greg
Purchase Details
Closed on
Oct 15, 2002
Sold by
Hud
Bought by
Bradshaw Michael
Purchase Details
Closed on
Apr 26, 2002
Sold by
Miller Marion C and The Leader Mtg Company
Bought by
Hud
Purchase Details
Closed on
Mar 1, 1989
Bought by
Miller Marion C
Purchase Details
Closed on
Jun 1, 1980
Create a Home Valuation Report for This Property
The Home Valuation Report is an in-depth analysis detailing your home's value as well as a comparison with similar homes in the area
Home Values in the Area
Average Home Value in this Area
Purchase History
| Date | Buyer | Sale Price | Title Company |
|---|---|---|---|
| Torres Sanjuanita | $35,000 | None Available | |
| Florida Costal Partners Llc | $79,200 | Colubus Title Agency Inc | |
| Oloughlin Greg | $8,000 | Trinity Tit | |
| Bradshaw Michael | $31,500 | Contract Processing & Title | |
| Hud | $32,600 | Independent Title | |
| Miller Marion C | $38,500 | -- | |
| -- | $26,300 | -- |
Source: Public Records
Tax History Compared to Growth
Tax History
| Year | Tax Paid | Tax Assessment Tax Assessment Total Assessment is a certain percentage of the fair market value that is determined by local assessors to be the total taxable value of land and additions on the property. | Land | Improvement |
|---|---|---|---|---|
| 2024 | $2,884 | $35,950 | $5,640 | $30,310 |
| 2023 | $1,593 | $35,945 | $5,635 | $30,310 |
| 2022 | $892 | $17,190 | $1,790 | $15,400 |
| 2021 | $1,123 | $17,190 | $1,790 | $15,400 |
| 2020 | $917 | $17,190 | $1,790 | $15,400 |
| 2019 | $873 | $14,040 | $1,510 | $12,530 |
| 2018 | $740 | $14,040 | $1,510 | $12,530 |
| 2017 | $873 | $14,040 | $1,510 | $12,530 |
| 2016 | $669 | $9,840 | $3,990 | $5,850 |
| 2015 | $609 | $9,840 | $3,990 | $5,850 |
| 2014 | $610 | $9,840 | $3,990 | $5,850 |
| 2013 | $353 | $11,550 | $4,690 | $6,860 |
Source: Public Records
Map
Nearby Homes
- 397 S Burgess Ave
- 471 S Terrace Ave Unit 473
- 405 S Burgess Ave
- 349 S Eureka Ave
- 426 S Eureka Ave
- 350 S Ogden Ave
- 365 S Ogden Ave
- 274 S Richardson Ave
- 337 S Wayne Ave
- 540 S Richardson Ave
- 327-329 S Wayne Ave
- 310 S Ogden Ave
- 418 S Warren Ave
- 444 S Warren Ave
- 448 S Warren Ave
- 334 S Warren Ave
- 500 S Warren Ave
- 238 S Richardson Ave
- 510 S Warren Ave
- 554 S Ogden Ave
- 402 S Richardson Ave
- 394 S Richardson Ave
- 406 S Richardson Ave
- 0 S Richardson Ave
- 386 S Richardson Ave
- 416 S Richardson Ave
- 378 S Richardson Ave
- 397 S Terrace Ave
- 401 S Terrace Ave
- 389 S Terrace Ave Unit 391
- 407 S Terrace Ave
- 385 S Terrace Ave Unit 387
- 397 S Richardson Ave
- 420 S Richardson Ave Unit 422
- 420 S Richardson Ave Unit 2
- 401 S Richardson Ave
- 393 S Richardson Ave
- 381 S Terrace Ave Unit 383
- 389 S Richardson Ave
- 405 S Richardson Ave