Estimated Value: $562,000 - $671,000
3
Beds
3
Baths
3,332
Sq Ft
$185/Sq Ft
Est. Value
About This Home
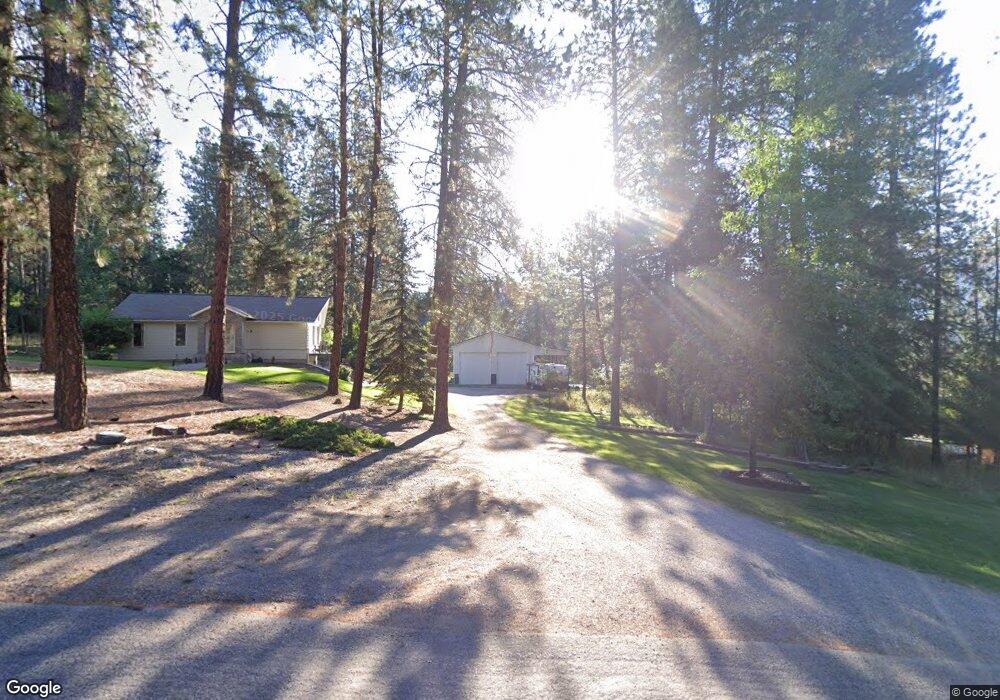
This home is located at 398 Shalom Dr, Libby, MT 59923 and is currently estimated at $614,931, approximately $184 per square foot. 398 Shalom Dr is a home located in Lincoln County with nearby schools including Libby Elementary School, Libby High School, and Kootenai Valley Christian School.
Ownership History
Date
Name
Owned For
Owner Type
Purchase Details
Closed on
Mar 20, 2007
Sold by
Harold Jack Harley and Harold Shirley F
Bought by
Riddle Joel A
Current Estimated Value
Home Financials for this Owner
Home Financials are based on the most recent Mortgage that was taken out on this home.
Original Mortgage
$247,500
Outstanding Balance
$150,054
Interest Rate
6.29%
Mortgage Type
New Conventional
Estimated Equity
$464,877
Purchase Details
Closed on
Nov 14, 2005
Sold by
Kujawa Gregory M and Kemner Margaret A
Bought by
Corporate Relocation Services
Purchase Details
Closed on
Jan 24, 2005
Sold by
Corporate Relocation Services
Bought by
Harold Jack Harley and Fittarold Shirler
Home Financials for this Owner
Home Financials are based on the most recent Mortgage that was taken out on this home.
Original Mortgage
$192,000
Interest Rate
6.15%
Mortgage Type
New Conventional
Create a Home Valuation Report for This Property
The Home Valuation Report is an in-depth analysis detailing your home's value as well as a comparison with similar homes in the area
Home Values in the Area
Average Home Value in this Area
Purchase History
| Date | Buyer | Sale Price | Title Company |
|---|---|---|---|
| Riddle Joel A | -- | First American Title Co | |
| Corporate Relocation Services | -- | None Available | |
| Harold Jack Harley | -- | First American Title Co Of M |
Source: Public Records
Mortgage History
| Date | Status | Borrower | Loan Amount |
|---|---|---|---|
| Open | Riddle Joel A | $247,500 | |
| Previous Owner | Harold Jack Harley | $192,000 | |
| Closed | Corporate Relocation Services | $0 |
Source: Public Records
Tax History
| Year | Tax Paid | Tax Assessment Tax Assessment Total Assessment is a certain percentage of the fair market value that is determined by local assessors to be the total taxable value of land and additions on the property. | Land | Improvement |
|---|---|---|---|---|
| 2025 | $1,890 | $537,000 | $0 | $0 |
| 2024 | $2,587 | $462,100 | $0 | $0 |
| 2023 | $3,238 | $462,100 | $0 | $0 |
| 2022 | $2,078 | $327,900 | $0 | $0 |
| 2021 | $2,324 | $294,500 | $0 | $0 |
| 2020 | $2,219 | $263,300 | $0 | $0 |
| 2019 | $2,202 | $263,300 | $0 | $0 |
| 2018 | $1,978 | $229,000 | $0 | $0 |
| 2017 | $1,794 | $229,000 | $0 | $0 |
| 2016 | $1,917 | $226,700 | $0 | $0 |
| 2015 | $1,402 | $226,700 | $0 | $0 |
| 2014 | $1,833 | $149,937 | $0 | $0 |
Source: Public Records
Map
Nearby Homes
- 55 Shalom Kerry Rd
- 30 Shalom Kerry Rd
- 584 Mack Rd
- 700 Airfield Rd
- 185 Riverdale Dr
- 118 Pine Grove Place
- 286 Edgewater Dr
- 142 Edgewater Dr
- 129 Airfield Rd
- 5 Eagle View Dr
- 105 Margaret Ln
- Nhn Ramona Dr
- 203 E 2nd St
- 109 W 2nd St
- 3100 Kootenai River Rd
- 612 W 1st St
- Lots 1-3 Kootenai Views Dr
- 555 Wisconsin Ave
- 501 Louisiana Ave
- 703 W 1st St
Your Personal Tour Guide
Ask me questions while you tour the home.