Estimated Value: $424,433 - $458,000
3
Beds
3
Baths
1,691
Sq Ft
$262/Sq Ft
Est. Value
About This Home
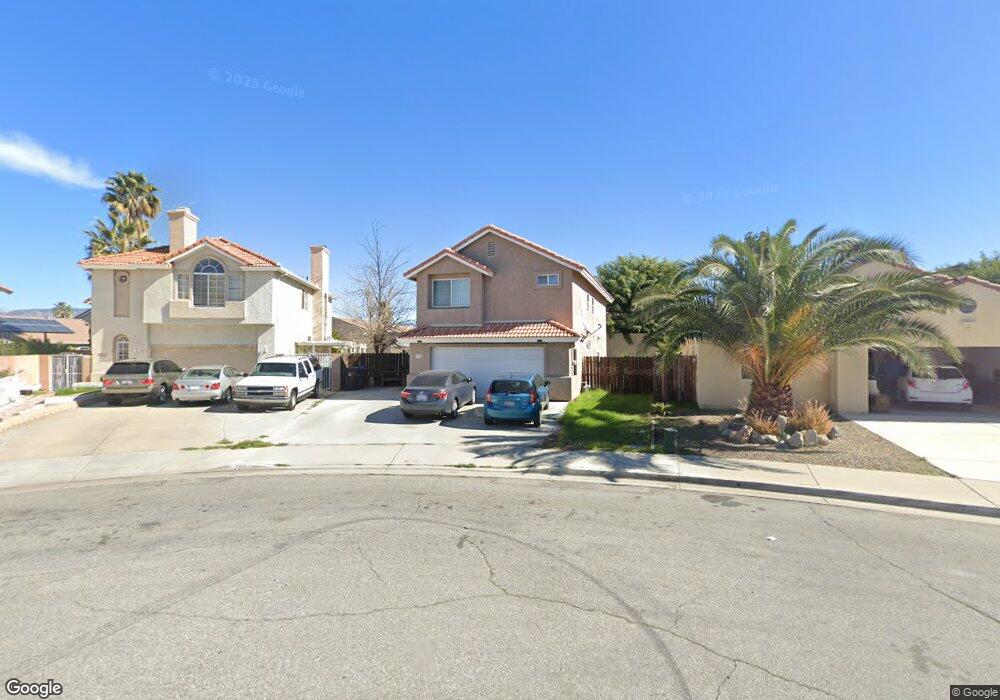
This home is located at 398 Via Corsica, Hemet, CA 92545 and is currently estimated at $442,608, approximately $261 per square foot. 398 Via Corsica is a home located in Riverside County with nearby schools including Cawston Elementary School, Rancho Viejo Middle School, and Tahquitz High School.
Ownership History
Date
Name
Owned For
Owner Type
Purchase Details
Closed on
Sep 21, 2009
Sold by
Suntrust Mortgage Inc
Bought by
U S Bank National Association
Current Estimated Value
Home Financials for this Owner
Home Financials are based on the most recent Mortgage that was taken out on this home.
Original Mortgage
$142,373
Outstanding Balance
$92,304
Interest Rate
5.02%
Mortgage Type
FHA
Estimated Equity
$350,304
Purchase Details
Closed on
Sep 10, 2009
Sold by
U S Bank National Association
Bought by
Reynoso Roberto and Reynoso Maria
Home Financials for this Owner
Home Financials are based on the most recent Mortgage that was taken out on this home.
Original Mortgage
$142,373
Outstanding Balance
$92,304
Interest Rate
5.02%
Mortgage Type
FHA
Estimated Equity
$350,304
Purchase Details
Closed on
Jun 12, 2009
Sold by
Epstein David and Epstein Sherry
Bought by
Suntrust Mortgage Inc
Purchase Details
Closed on
Oct 26, 1994
Sold by
Thompson Charles and Thompson Regine
Bought by
Thompson Charles and Thompson Regine
Create a Home Valuation Report for This Property
The Home Valuation Report is an in-depth analysis detailing your home's value as well as a comparison with similar homes in the area
Home Values in the Area
Average Home Value in this Area
Purchase History
| Date | Buyer | Sale Price | Title Company |
|---|---|---|---|
| U S Bank National Association | -- | Chicago Title Company | |
| Reynoso Roberto | $145,000 | Chicago Title Company | |
| Suntrust Mortgage Inc | $120,500 | Multiple | |
| Thompson Charles | -- | -- |
Source: Public Records
Mortgage History
| Date | Status | Borrower | Loan Amount |
|---|---|---|---|
| Open | Reynoso Roberto | $142,373 |
Source: Public Records
Tax History Compared to Growth
Tax History
| Year | Tax Paid | Tax Assessment Tax Assessment Total Assessment is a certain percentage of the fair market value that is determined by local assessors to be the total taxable value of land and additions on the property. | Land | Improvement |
|---|---|---|---|---|
| 2025 | $2,340 | $196,102 | $38,714 | $157,388 |
| 2023 | $2,340 | $188,488 | $37,211 | $151,277 |
| 2022 | $2,271 | $184,793 | $36,482 | $148,311 |
| 2021 | $2,235 | $181,170 | $35,767 | $145,403 |
| 2020 | $2,214 | $179,314 | $35,401 | $143,913 |
| 2019 | $2,168 | $175,799 | $34,707 | $141,092 |
| 2018 | $2,105 | $172,353 | $34,028 | $138,325 |
| 2017 | $2,082 | $168,974 | $33,361 | $135,613 |
| 2016 | $2,067 | $165,661 | $32,707 | $132,954 |
| 2015 | $2,062 | $163,175 | $32,217 | $130,958 |
| 2014 | $1,975 | $159,981 | $31,587 | $128,394 |
Source: Public Records
Map
Nearby Homes
- 372 Via Capri
- 3727 Anchorage St
- 508 Louisville St
- 3671 Sydney St
- 442 Stockholm Ct
- 3807 Seattle St
- 411 N Sanderson Ave
- 669 Liverpool St
- 3103 Janae Way
- 3093 Oradon Way
- 4400 W Florida Ave Unit 252
- 4400 W Florida Ave Unit 277
- 4400 W Florida Ave Unit 87
- 766 Conlon Dr
- 4190 Annatto Ln
- 860 Provance St
- 2864 Lynae Way
- 831 Coriander Dr Unit 405
- 3831 Wild Sienna Trail
- 986 Coriander Dr Unit 304
- 388 Via Corsica
- 3900 Via Barcelona
- 3916 Via Barcelona
- 3932 Via Barcelona
- 368 Via Corsica
- 393 Via Corsica
- 3907 Anchorage St
- 3927 Anchorage St
- 3948 Via Barcelona
- 3887 Anchorage St
- 383 Via Corsica
- 358 Via Corsica
- 3947 Anchorage St
- 373 Via Corsica
- 3867 Anchorage St
- 3964 Via Barcelona
- 348 Via Corsica
- 363 Via Corsica
- 392 Via Capri
- 3847 Anchorage St