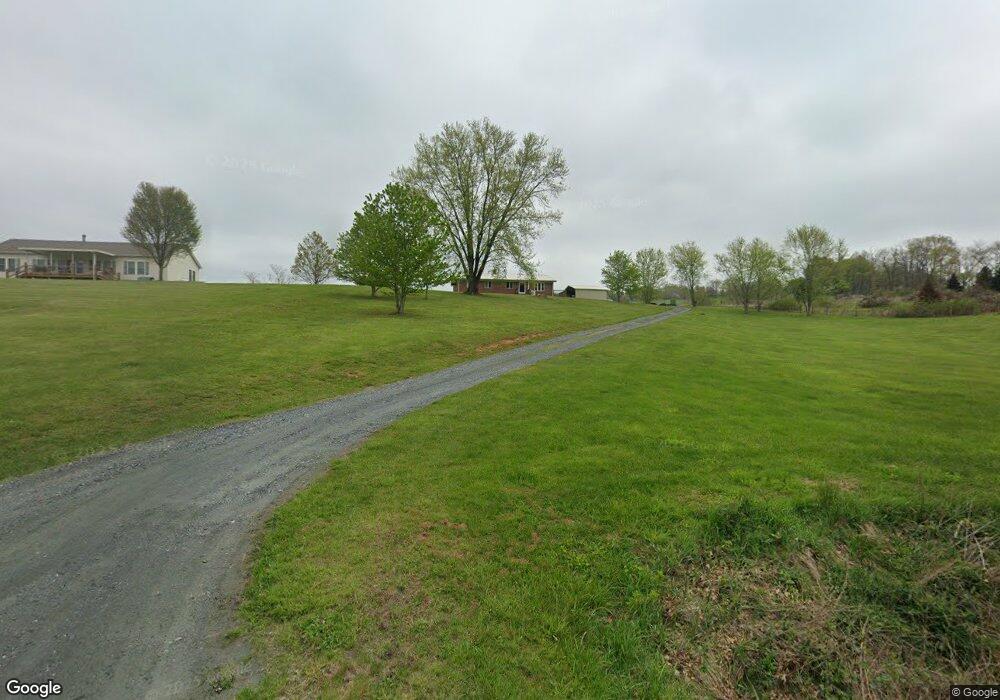
398 Wagoner Access Rd Jefferson, NC 28640
Estimated Value: $373,690 - $463,000
--
Bed
--
Bath
2,192
Sq Ft
$186/Sq Ft
Est. Value
About This Home
This home is located at 398 Wagoner Access Rd, Jefferson, NC 28640 and is currently estimated at $407,423, approximately $185 per square foot. 398 Wagoner Access Rd is a home with nearby schools including Ashe County High School.
Ownership History
Date
Name
Owned For
Owner Type
Purchase Details
Closed on
Aug 25, 2022
Sold by
Elizabeth Holman Kellie
Bought by
Holman Kellie Elizabeth and Yingling Rebecca Ann
Current Estimated Value
Purchase Details
Closed on
Jan 15, 2021
Sold by
Isler Richard E and Isler Kimberley M
Bought by
Holman Kellie Elizabeth
Home Financials for this Owner
Home Financials are based on the most recent Mortgage that was taken out on this home.
Original Mortgage
$211,105
Interest Rate
2.71%
Mortgage Type
FHA
Purchase Details
Closed on
Mar 30, 2006
Sold by
Holman Robert S and Holman Deborah
Bought by
Isler Richard E and Isler Kimberly M
Home Financials for this Owner
Home Financials are based on the most recent Mortgage that was taken out on this home.
Original Mortgage
$155,900
Interest Rate
6.25%
Mortgage Type
New Conventional
Create a Home Valuation Report for This Property
The Home Valuation Report is an in-depth analysis detailing your home's value as well as a comparison with similar homes in the area
Home Values in the Area
Average Home Value in this Area
Purchase History
| Date | Buyer | Sale Price | Title Company |
|---|---|---|---|
| Holman Kellie Elizabeth | -- | Law Office Of Heather R Klein | |
| Holman Kellie Elizabeth | $215,000 | None Available | |
| Isler Richard E | $195,000 | -- |
Source: Public Records
Mortgage History
| Date | Status | Borrower | Loan Amount |
|---|---|---|---|
| Previous Owner | Holman Kellie Elizabeth | $211,105 | |
| Previous Owner | Isler Richard E | $155,900 |
Source: Public Records
Tax History Compared to Growth
Tax History
| Year | Tax Paid | Tax Assessment Tax Assessment Total Assessment is a certain percentage of the fair market value that is determined by local assessors to be the total taxable value of land and additions on the property. | Land | Improvement |
|---|---|---|---|---|
| 2025 | $1,460 | $290,300 | $27,900 | $262,400 |
| 2024 | $1,373 | $290,300 | $27,900 | $262,400 |
| 2023 | $1,373 | $290,300 | $27,900 | $262,400 |
| 2022 | $1,129 | $181,600 | $23,600 | $158,000 |
| 2021 | $1,129 | $181,600 | $23,600 | $158,000 |
| 2020 | $1,007 | $181,600 | $23,600 | $158,000 |
| 2019 | $987 | $181,600 | $23,600 | $158,000 |
| 2018 | $985 | $185,300 | $23,600 | $161,700 |
| 2016 | $973 | $182,400 | $23,600 | $158,800 |
| 2015 | $999 | $182,400 | $23,600 | $158,800 |
| 2014 | $999 | $202,500 | $32,900 | $169,600 |
Source: Public Records
Map
Nearby Homes
- 330 Crain Branch Ln
- 87 Village On the New Dr
- 218 Cherokee Cir
- TBD lot 40 Creek Ct
- TBD - Lot 40 Creek Ct
- 230 N Carolina 88
- 230 Nc Highway 88 E
- TBD Lot 30 Shawnee Trail
- TBD (Lot 41) Creek Ct
- 573 Canawhay Dr
- TBD Shawnee Trail
- Lot 43 Creek Ct
- TBD E Landing Ridge Cir Unit 24
- 63 Village Pine Dr
- 594 Village Pine Dr
- 58 N Landing Dr
- 54 N Landing Dr
- 891 Olde Charter Cir Unit 42 & 43
- 891 Olde Charter Cir
- TBD (Lot 5) Village Ct
- 484 Wagoner Access Rd
- 417 Wagoner Access Rd
- 504 Wagoner Access Rd
- 272 Wagoner Access Rd
- 380 Wagoner Access Rd
- 485 Wagoner Access Rd
- 299 Wagoner Access Rd
- 162 Wagoner Access Rd
- 1857 Nc Highway 88 E
- 1771 Nc Highway 88 E
- 0 Burgess Rd
- 1751 Nc Highway 88 E
- 1701 Nc Highway 88 E
- 1788 Nc Highway 88 E
- 680 Wagoner Access Rd
- 455 Wagoner Access Rd
- 142 Burgess Rd
- 2002 Nc Highway 88 E
- 149 Burgess Rd
- 108 Dishman Severt Rd