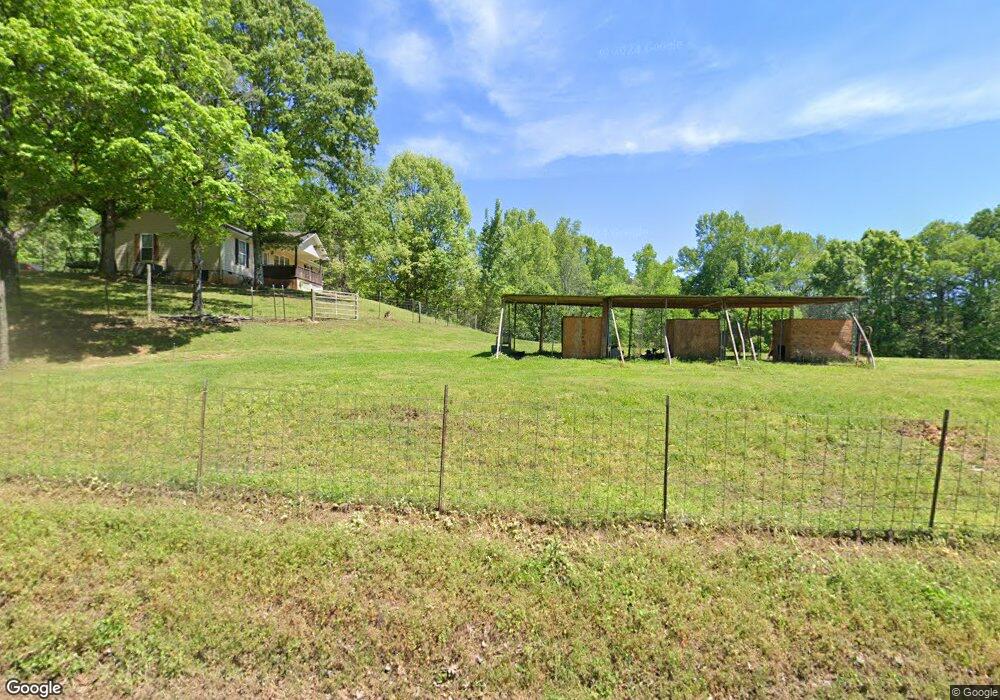
3980 Old Mineral Springs Rd La Fayette, GA 30728
Estimated Value: $251,883 - $315,000
--
Bed
2
Baths
1,544
Sq Ft
$183/Sq Ft
Est. Value
About This Home
This home is located at 3980 Old Mineral Springs Rd, La Fayette, GA 30728 and is currently estimated at $281,971, approximately $182 per square foot. 3980 Old Mineral Springs Rd is a home located in Walker County with nearby schools including Gilbert Elementary School, Lafayette Middle School, and Lafayette High School.
Ownership History
Date
Name
Owned For
Owner Type
Purchase Details
Closed on
Dec 20, 2004
Sold by
Hill Gregory Michael
Bought by
Hill Gregory M and Hill Barbara J
Current Estimated Value
Purchase Details
Closed on
Aug 3, 1998
Sold by
Hill William
Bought by
Hill Gregory Michael
Purchase Details
Closed on
Oct 17, 1991
Sold by
Barfield Edith P
Bought by
Hill William
Purchase Details
Closed on
Sep 17, 1991
Sold by
Barfield Richard S and Barfield Edith P
Bought by
Barfield Edith P
Purchase Details
Closed on
Sep 1, 1990
Sold by
Barfield Edith P
Bought by
Barfield Richard S and Barfield Edith P
Purchase Details
Closed on
Mar 15, 1990
Sold by
Barfield Richard S and Barfield Edith
Bought by
Barfield Edith P
Purchase Details
Closed on
Jan 1, 1979
Sold by
Osment Ralph L
Bought by
Barfield Richard S and Barfield Edith
Purchase Details
Closed on
May 29, 1964
Bought by
Osment Ralph L
Create a Home Valuation Report for This Property
The Home Valuation Report is an in-depth analysis detailing your home's value as well as a comparison with similar homes in the area
Home Values in the Area
Average Home Value in this Area
Purchase History
| Date | Buyer | Sale Price | Title Company |
|---|---|---|---|
| Hill Gregory M | -- | -- | |
| Hill Gregory Michael | -- | -- | |
| Hill William | $20,000 | -- | |
| Barfield Edith P | -- | -- | |
| Barfield Richard S | -- | -- | |
| Barfield Edith P | -- | -- | |
| Barfield Richard S | $20,000 | -- | |
| Osment Ralph L | -- | -- |
Source: Public Records
Tax History Compared to Growth
Tax History
| Year | Tax Paid | Tax Assessment Tax Assessment Total Assessment is a certain percentage of the fair market value that is determined by local assessors to be the total taxable value of land and additions on the property. | Land | Improvement |
|---|---|---|---|---|
| 2024 | $912 | $94,691 | $19,585 | $75,106 |
| 2023 | $793 | $86,686 | $15,544 | $71,142 |
| 2022 | $1,634 | $65,716 | $4,688 | $61,028 |
| 2021 | $1,472 | $53,250 | $4,688 | $48,562 |
| 2020 | $1,228 | $42,246 | $4,688 | $37,558 |
| 2019 | $1,250 | $42,246 | $4,688 | $37,558 |
| 2018 | $1,118 | $42,246 | $4,688 | $37,558 |
| 2017 | $1,367 | $42,246 | $4,688 | $37,558 |
| 2016 | $1,115 | $42,246 | $4,688 | $37,558 |
| 2015 | $1,131 | $40,438 | $5,200 | $35,238 |
| 2014 | $1,035 | $40,438 | $5,200 | $35,238 |
| 2013 | -- | $40,438 | $5,200 | $35,238 |
Source: Public Records
Map
Nearby Homes
- 0 Twin Lakes Rd
- 217 Old Warren School Rd
- 974 & 976 Dripping Springs Rd
- 154 Old Warren School Rd
- 164 Old Warren School Rd
- 197 Old Warren School Rd
- 144 Old Warren School Rd
- Hanover Plan at Price's Crossing
- Cali Plan at Price's Crossing
- Belhaven Plan at Price's Crossing
- Aria Plan at Price's Crossing
- Penwell Plan at Price's Crossing
- Salem Plan at Price's Crossing
- 0 N Highway 27 Unit RTC2680391
- 0 N Highway 27 Unit 1395752
- 0 E Warren Rd Unit RTC2681365
- 0 E Warren Rd Unit 1395828
- 1309 Campbell Crescent
- 1314 Fernwood Dr
- Lot 3 Cedar Farm Rd
- 4034 Old Mineral Springs Rd
- 3836 Old Mineral Springs Rd
- 1441 W Highway 136
- 116 Twin Lakes Rd
- 116 Twin Lakes Rd
- 128 Twin Lakes Rd
- 133 Twin Lakes Rd
- 1489 W Highway 136
- 70 Twin Lakes Rd
- 64 Twin Lakes Rd
- 88 Twin Lakes Rd
- 73 Twin Lakes Rd
- 1071 Georgia 136
- 104 Sullivan Ln
- 105 Twin Lakes Rd
- 95 Sullivan Ln
- 4346 Old Mineral Springs Rd
- 22 Deep Woods Ln
- 113 Deep Woods Ln
- 184 Sullivan Ln