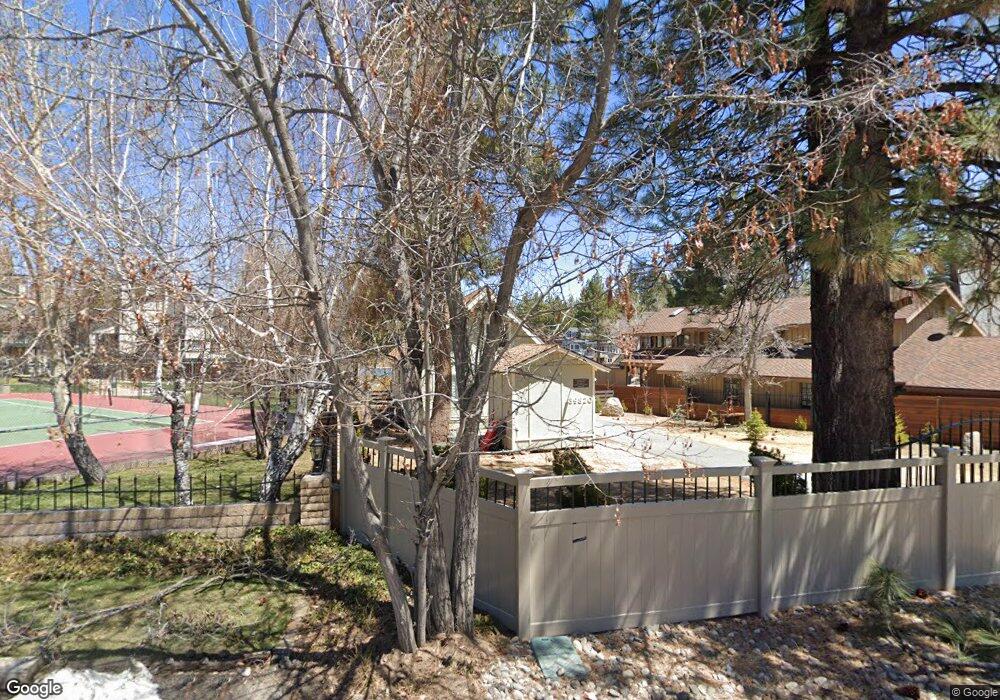
39820 Lakeview Dr Big Bear Lake, CA 92315
Estimated Value: $853,000 - $1,061,000
2
Beds
2
Baths
1,384
Sq Ft
$671/Sq Ft
Est. Value
About This Home
This home is located at 39820 Lakeview Dr, Big Bear Lake, CA 92315 and is currently estimated at $928,440, approximately $670 per square foot. 39820 Lakeview Dr is a home located in San Bernardino County with nearby schools including Big Bear Middle School and Big Bear High School.
Ownership History
Date
Name
Owned For
Owner Type
Purchase Details
Closed on
Jan 26, 2021
Sold by
Spalding Anita L
Bought by
Mcclintock Clive M
Current Estimated Value
Home Financials for this Owner
Home Financials are based on the most recent Mortgage that was taken out on this home.
Original Mortgage
$548,250
Outstanding Balance
$490,349
Interest Rate
2.7%
Mortgage Type
New Conventional
Estimated Equity
$438,091
Purchase Details
Closed on
Apr 2, 2008
Sold by
Leaper John W
Bought by
Leaper John W
Purchase Details
Closed on
Dec 6, 2005
Sold by
Leaper John W and Leaper Dorothy Ann
Bought by
Leaper John W and Leaper Dorothy A
Purchase Details
Closed on
Mar 7, 1994
Sold by
Leaper John W and Leaper Dorothy A
Bought by
Leaper John W and Leaper Dorothy Ann
Home Financials for this Owner
Home Financials are based on the most recent Mortgage that was taken out on this home.
Original Mortgage
$130,000
Interest Rate
7%
Mortgage Type
Purchase Money Mortgage
Create a Home Valuation Report for This Property
The Home Valuation Report is an in-depth analysis detailing your home's value as well as a comparison with similar homes in the area
Home Values in the Area
Average Home Value in this Area
Purchase History
| Date | Buyer | Sale Price | Title Company |
|---|---|---|---|
| Mcclintock Clive M | $770,000 | Fidelity National Title Co | |
| Leaper John W | -- | None Available | |
| Leaper John W | -- | -- | |
| Leaper John W | -- | Investors Title Company |
Source: Public Records
Mortgage History
| Date | Status | Borrower | Loan Amount |
|---|---|---|---|
| Open | Mcclintock Clive M | $548,250 | |
| Previous Owner | Leaper John W | $130,000 |
Source: Public Records
Tax History Compared to Growth
Tax History
| Year | Tax Paid | Tax Assessment Tax Assessment Total Assessment is a certain percentage of the fair market value that is determined by local assessors to be the total taxable value of land and additions on the property. | Land | Improvement |
|---|---|---|---|---|
| 2025 | $9,808 | $833,473 | $166,695 | $666,778 |
| 2024 | $9,808 | $817,130 | $163,426 | $653,704 |
| 2023 | $9,591 | $801,108 | $160,222 | $640,886 |
| 2022 | $9,290 | $785,400 | $157,080 | $628,320 |
| 2021 | $4,638 | $349,017 | $234,485 | $114,532 |
| 2020 | $4,695 | $345,439 | $232,081 | $113,358 |
| 2019 | $4,582 | $338,665 | $227,530 | $111,135 |
| 2018 | $4,431 | $332,025 | $223,069 | $108,956 |
| 2017 | $4,319 | $325,515 | $218,695 | $106,820 |
| 2016 | $4,226 | $319,132 | $214,407 | $104,725 |
| 2015 | $4,191 | $314,338 | $211,186 | $103,152 |
| 2014 | $4,118 | $308,180 | $207,049 | $101,131 |
Source: Public Records
Map
Nearby Homes
- 39802 Lakeview Dr Unit 32
- 39961 Lakeview Dr
- 39656 Forest Rd
- 195 Elgin Rd
- 344 Edgemoor Rd
- 39900 Forest Rd
- 380 Canvasback Dr
- 39934 Forest Rd
- 425 Castella Ln
- 183 Lagunita Ln
- 193 Lagunita Ln
- 415 Piney Ln
- 430 Piney Ln
- 39969 Forest Rd
- 448 Edgemoor Rd
- 0 Arroyo Dr
- 446 Shady Ln
- 438 Boyd Trail
- 161 Round Dr
- 40153 Lakeview Dr
- 39820 Lakeview Dr
- 39820 Lakeview Dr
- 39828 Lakeview Dr
- 39828 Lakeview Dr
- 39807 Lakeview Dr
- 39832 Lakeview Dr
- 39832 Lake View Dr
- 39815 Lakeview Dr
- 39802 Lakeview Dr
- 39802 Lakeview Dr Unit 25
- 39807 Lakeview Dr
- 39882 Lakeview Dr
- 39870 Lakeview Dr
- 39880 Lakeview Dr
- 39797 Lakeview Dr
- 39802 Lakeview Dr Unit 21
- 39802 Lakeview Dr Unit 9
- 39802 Lakeview Dr Unit 31
- 39802 Lakeview Dr Unit 11
- 39802 Lakeview Dr Unit 2