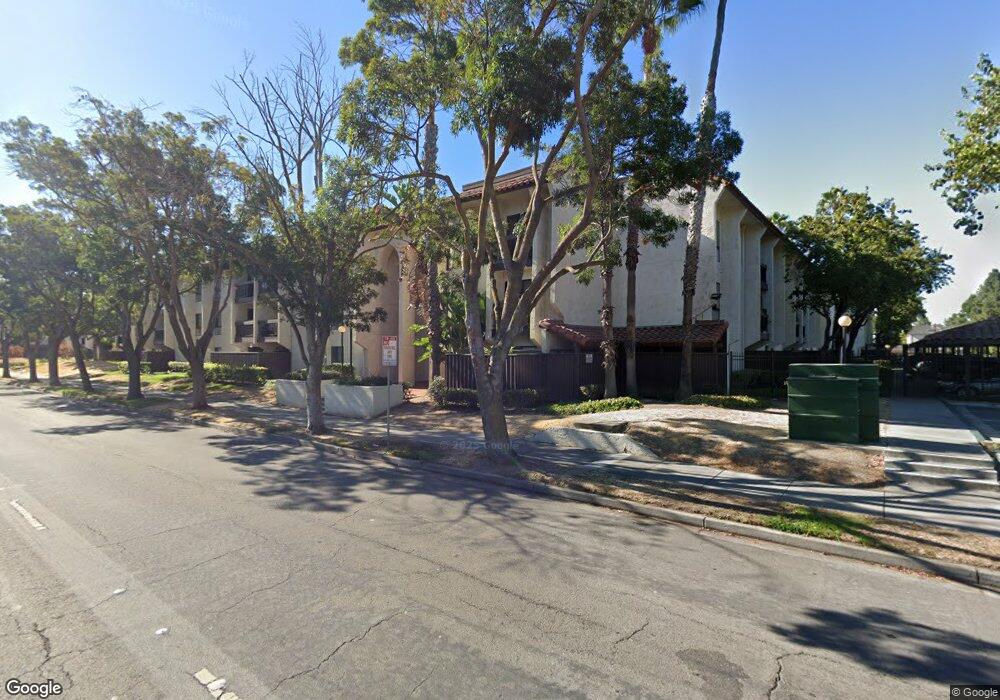
39821 Cedar Blvd Unit 213 Newark, CA 94560
Birch Grove NeighborhoodEstimated Value: $551,000 - $680,000
2
Beds
2
Baths
1,071
Sq Ft
$549/Sq Ft
Est. Value
About This Home
This home is located at 39821 Cedar Blvd Unit 213, Newark, CA 94560 and is currently estimated at $588,312, approximately $549 per square foot. 39821 Cedar Blvd Unit 213 is a home located in Alameda County with nearby schools including Birch Grove Primary School, Newark Junior High School, and Newark Memorial High School.
Ownership History
Date
Name
Owned For
Owner Type
Purchase Details
Closed on
Aug 17, 2017
Sold by
Pardasani Raj and Pardasani Geeta
Bought by
Geeta Pardasani Raj and Geeta Pardosani
Current Estimated Value
Purchase Details
Closed on
Aug 31, 2005
Sold by
Symons Paul Robert
Bought by
Pardasani Raj K and Pardasani Geeta
Home Financials for this Owner
Home Financials are based on the most recent Mortgage that was taken out on this home.
Original Mortgage
$364,500
Outstanding Balance
$196,843
Interest Rate
6%
Mortgage Type
Unknown
Estimated Equity
$391,469
Purchase Details
Closed on
Apr 23, 1997
Sold by
Ho King T and Jumin Jaw
Bought by
Symons Paul Robert
Home Financials for this Owner
Home Financials are based on the most recent Mortgage that was taken out on this home.
Original Mortgage
$100,000
Interest Rate
7.96%
Create a Home Valuation Report for This Property
The Home Valuation Report is an in-depth analysis detailing your home's value as well as a comparison with similar homes in the area
Home Values in the Area
Average Home Value in this Area
Purchase History
| Date | Buyer | Sale Price | Title Company |
|---|---|---|---|
| Geeta Pardasani Raj | -- | None Available | |
| Pardasani Raj K | $405,000 | Commonwealth Land Title Co | |
| Symons Paul Robert | $125,000 | American Title Co |
Source: Public Records
Mortgage History
| Date | Status | Borrower | Loan Amount |
|---|---|---|---|
| Open | Pardasani Raj K | $364,500 | |
| Previous Owner | Symons Paul Robert | $100,000 |
Source: Public Records
Tax History
| Year | Tax Paid | Tax Assessment Tax Assessment Total Assessment is a certain percentage of the fair market value that is determined by local assessors to be the total taxable value of land and additions on the property. | Land | Improvement |
|---|---|---|---|---|
| 2025 | $6,825 | $546,415 | $166,024 | $387,391 |
| 2024 | $6,825 | $535,565 | $162,769 | $379,796 |
| 2023 | $6,636 | $531,930 | $159,579 | $372,351 |
| 2022 | $6,547 | $514,501 | $156,450 | $365,051 |
| 2021 | $6,389 | $504,280 | $153,384 | $357,896 |
| 2020 | $6,283 | $506,038 | $151,811 | $354,227 |
| 2019 | $6,192 | $496,120 | $148,836 | $347,284 |
| 2018 | $6,098 | $486,396 | $145,919 | $340,477 |
| 2017 | $5,942 | $476,862 | $143,058 | $333,804 |
| 2016 | $5,444 | $431,000 | $129,300 | $301,700 |
| 2015 | $4,649 | $360,000 | $108,000 | $252,000 |
| 2014 | $4,277 | $332,000 | $99,600 | $232,400 |
Source: Public Records
Map
Nearby Homes
- 39843 Cedar Blvd Unit 227
- 39843 Cedar Blvd Unit 219
- 39861 Pelton Terrace
- 39975 Cedar Blvd Unit 136
- 39931 Cedar Blvd Unit 305
- 39997 Cedar Blvd Unit 248
- 6001 Joaquin Murieta Ave Unit C
- 6043 Joaquin Murieta Ave Unit D
- 6023 Joaquin Murieta Ave Unit A
- 39965 Potrero Dr
- 6332 Buena Vista Dr Unit B
- 6281 Joaquin Murieta Ave Unit F
- 6318 Joaquin Murieta Ave Unit B
- 6382 Buena Vista Dr Unit B
- 6369 Joaquin Murieta Ave Unit D
- 6341 Joaquin Murieta Ave Unit C
- 39438 Humpback Whale Rd
- 39441 Humpback Whale Rd
- 5706 Willkie Place
- 5751 Birch Terrace
- 39887 Cedar Blvd
- 39843 Cedar Blvd
- 39843 Cedar Blvd
- 39887 Cedar Blvd
- 39821 Cedar Blvd
- 39821 Cedar Blvd Unit 314
- 39821 Cedar Blvd Unit 315
- 39821 Cedar Blvd Unit 316
- 39821 Cedar Blvd Unit 201
- 39821 Cedar Blvd Unit 202
- 39821 Cedar Blvd Unit 204
- 39821 Cedar Blvd Unit 205
- 39821 Cedar Blvd Unit 206
- 39821 Cedar Blvd Unit 207
- 39821 Cedar Blvd Unit 208
- 39821 Cedar Blvd Unit 209
- 39821 Cedar Blvd Unit 210
- 39821 Cedar Blvd Unit 211
- 39821 Cedar Blvd Unit 212
- 39843 Cedar Blvd Unit 124
Your Personal Tour Guide
Ask me questions while you tour the home.