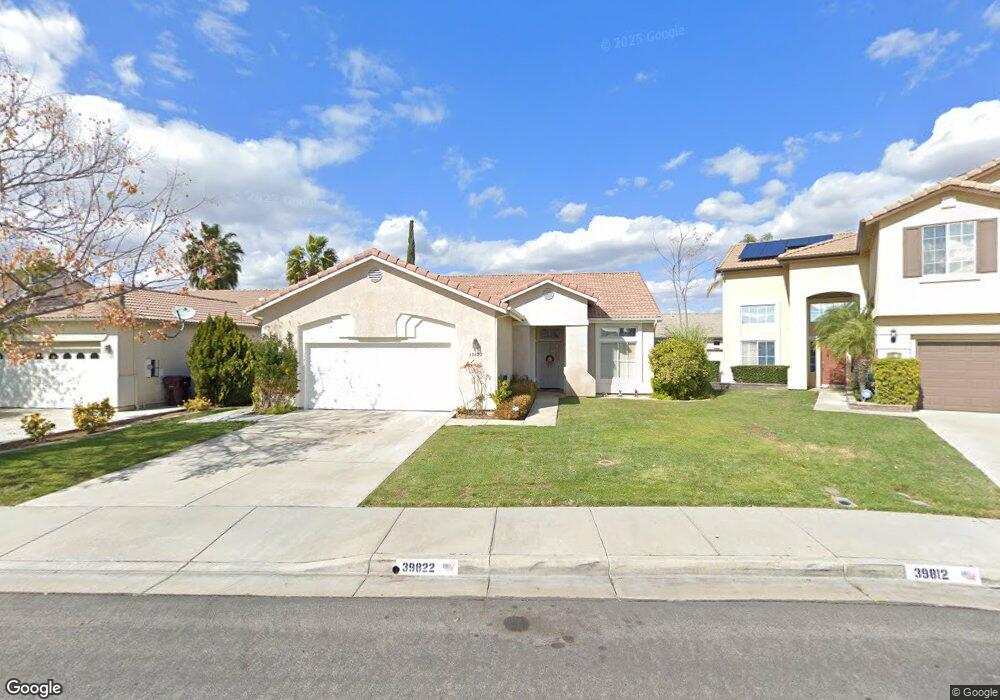
39822 De Vendome Ct Murrieta, CA 92563
Vintage Reserve NeighborhoodEstimated Value: $610,783 - $678,000
4
Beds
2
Baths
1,740
Sq Ft
$376/Sq Ft
Est. Value
About This Home
This home is located at 39822 De Vendome Ct, Murrieta, CA 92563 and is currently estimated at $654,446, approximately $376 per square foot. 39822 De Vendome Ct is a home located in Riverside County with nearby schools including Buchanan Elementary School, Warm Springs Middle School, and Vista Murrieta High School.
Ownership History
Date
Name
Owned For
Owner Type
Purchase Details
Closed on
Nov 12, 2018
Sold by
Ertley Ernest W
Bought by
Ertley Ernest W
Current Estimated Value
Purchase Details
Closed on
Aug 8, 2000
Sold by
Locke Robert L and Locke Katherine L
Bought by
Ertley Ernest W and Ertley Priscilla Diane
Home Financials for this Owner
Home Financials are based on the most recent Mortgage that was taken out on this home.
Original Mortgage
$120,000
Outstanding Balance
$43,296
Interest Rate
8.15%
Mortgage Type
Purchase Money Mortgage
Estimated Equity
$611,150
Purchase Details
Closed on
Nov 26, 1997
Sold by
Arbor Walk Lp
Bought by
Locke Robert L and Locke Katherine L
Home Financials for this Owner
Home Financials are based on the most recent Mortgage that was taken out on this home.
Original Mortgage
$138,599
Interest Rate
6.98%
Mortgage Type
FHA
Create a Home Valuation Report for This Property
The Home Valuation Report is an in-depth analysis detailing your home's value as well as a comparison with similar homes in the area
Home Values in the Area
Average Home Value in this Area
Purchase History
| Date | Buyer | Sale Price | Title Company |
|---|---|---|---|
| Ertley Ernest W | -- | None Available | |
| Ertley Ernest W | -- | None Available | |
| Ertley Ernest W | $190,000 | First American Title Co | |
| Locke Robert L | $141,500 | First American Title Ins Co |
Source: Public Records
Mortgage History
| Date | Status | Borrower | Loan Amount |
|---|---|---|---|
| Open | Ertley Ernest W | $120,000 | |
| Previous Owner | Locke Robert L | $138,599 |
Source: Public Records
Tax History Compared to Growth
Tax History
| Year | Tax Paid | Tax Assessment Tax Assessment Total Assessment is a certain percentage of the fair market value that is determined by local assessors to be the total taxable value of land and additions on the property. | Land | Improvement |
|---|---|---|---|---|
| 2025 | $5,339 | $434,367 | $95,152 | $339,215 |
| 2023 | $5,339 | $275,010 | $57,919 | $217,091 |
| 2022 | $3,622 | $269,619 | $56,784 | $212,835 |
| 2021 | $3,560 | $264,333 | $55,671 | $208,662 |
| 2020 | $3,525 | $261,624 | $55,101 | $206,523 |
| 2019 | $3,463 | $256,495 | $54,021 | $202,474 |
| 2018 | $3,403 | $251,466 | $52,962 | $198,504 |
| 2017 | $3,360 | $246,536 | $51,924 | $194,612 |
| 2016 | $3,318 | $241,703 | $50,906 | $190,797 |
| 2015 | $3,288 | $238,075 | $50,143 | $187,932 |
| 2014 | $3,152 | $233,412 | $49,161 | $184,251 |
Source: Public Records
Map
Nearby Homes
- 39832 De Vendome Ct
- 39812 De Vendome Ct
- 39719 Chambray Dr
- 39565 Torrey Pines Rd
- 26738 Silver Oaks Dr
- 39624 Tamarisk St
- 39071 Agua Vista
- 28661 Via Las Flores
- 39635 Columbia Union Dr Unit C
- 39723 Columbia Union Dr
- 39678 Columbia Union Dr
- 25933 Schafer Dr
- 26154 Williams Way Unit B
- 39738 Columbia Union Dr Unit B
- 26133 Williams Way Unit C
- 29170 Via Princesa
- 26921 Saint Kitts Ct
- 28356 Princessa Ct
- 28900 Via La Espalda
- 29441 Via la Plaza
- 39813 Saint Honore Dr
- 39803 Saint Honore Dr
- 39823 Saint Honore Dr
- 39842 De Vendome Ct
- 39793 Saint Honore Dr
- 39833 Saint Honore Dr
- 39852 De Vendome Ct
- 39835 De Vendome Ct
- 39805 De Vendome Ct
- 39845 De Vendome Ct
- 39825 De Vendome Ct
- 39843 Saint Honore Dr
- 39783 Saint Honore Dr
- 39855 De Vendome Ct
- 39862 De Vendome Ct
- 39815 De Vendome Ct
- 39853 Saint Honore Dr
- 39810 Saint Honore Dr
- 39820 Saint Honore Dr
- 39865 De Vendome Ct