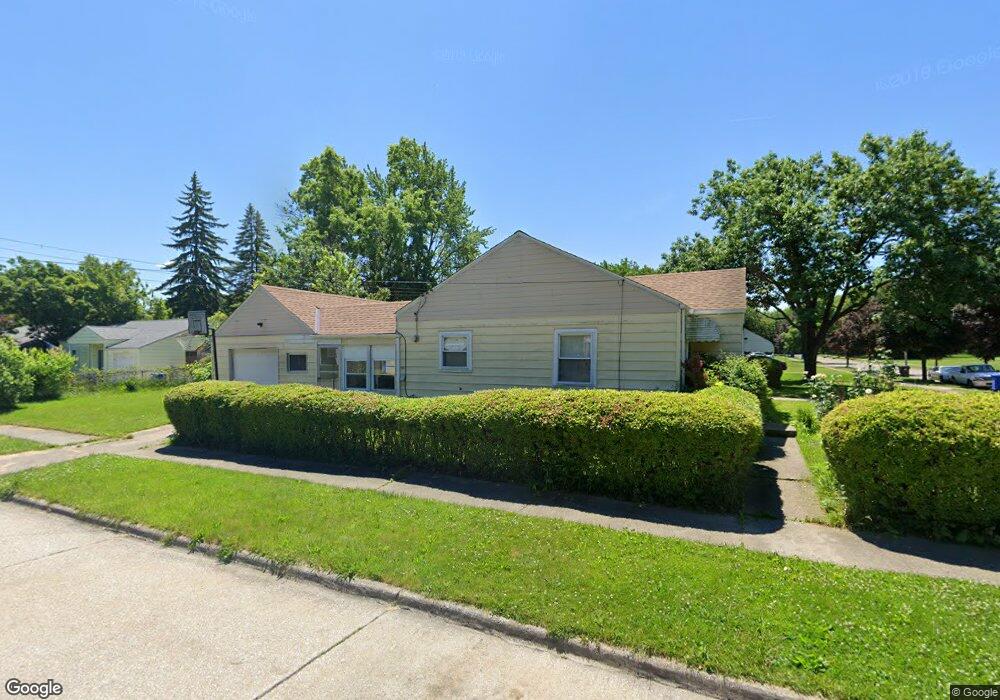
3983 W 146th St Cleveland, OH 44111
Jefferson NeighborhoodEstimated Value: $124,000 - $142,000
3
Beds
1
Bath
960
Sq Ft
$139/Sq Ft
Est. Value
About This Home
This home is located at 3983 W 146th St, Cleveland, OH 44111 and is currently estimated at $133,087, approximately $138 per square foot. 3983 W 146th St is a home located in Cuyahoga County with nearby schools including Artemus Ward School, Almira Academy, and Benjamin Franklin.
Ownership History
Date
Name
Owned For
Owner Type
Purchase Details
Closed on
Feb 12, 2025
Sold by
Clpthree Llc
Bought by
3983 W 146 Llc
Current Estimated Value
Home Financials for this Owner
Home Financials are based on the most recent Mortgage that was taken out on this home.
Original Mortgage
$132,605
Outstanding Balance
$131,837
Interest Rate
7.04%
Mortgage Type
Seller Take Back
Estimated Equity
$1,250
Purchase Details
Closed on
Jul 1, 2024
Sold by
Paullin Craig and Paullin Laurie
Bought by
Clpthree Llc
Purchase Details
Closed on
Jul 31, 2007
Sold by
Paullin Housing Llc
Bought by
Paullin Craig
Purchase Details
Closed on
Jan 10, 2005
Sold by
Paullin Craig L
Bought by
Paullin Housing Llc
Purchase Details
Closed on
Aug 8, 2002
Sold by
Cassidy Barbara
Bought by
Paullin Craig L
Purchase Details
Closed on
Jun 29, 2001
Sold by
Estate Of Jack F Heiser
Bought by
Heiser Gertrude F
Purchase Details
Closed on
Jan 1, 1975
Bought by
Heiser Jack F and Heiser Gertrude F
Create a Home Valuation Report for This Property
The Home Valuation Report is an in-depth analysis detailing your home's value as well as a comparison with similar homes in the area
Home Values in the Area
Average Home Value in this Area
Purchase History
| Date | Buyer | Sale Price | Title Company |
|---|---|---|---|
| 3983 W 146 Llc | $132,100 | Surety Title | |
| Clpthree Llc | -- | None Listed On Document | |
| Clpthree Llc | -- | None Listed On Document | |
| Paullin Craig | -- | None Available | |
| Paullin Housing Llc | -- | Attorney | |
| Paullin Craig L | $56,000 | -- | |
| Heiser Gertrude F | -- | -- | |
| Heiser Jack F | -- | -- |
Source: Public Records
Mortgage History
| Date | Status | Borrower | Loan Amount |
|---|---|---|---|
| Open | 3983 W 146 Llc | $132,605 |
Source: Public Records
Tax History Compared to Growth
Tax History
| Year | Tax Paid | Tax Assessment Tax Assessment Total Assessment is a certain percentage of the fair market value that is determined by local assessors to be the total taxable value of land and additions on the property. | Land | Improvement |
|---|---|---|---|---|
| 2024 | $2,479 | $37,065 | $8,715 | $28,350 |
| 2023 | $1,788 | $23,070 | $5,920 | $17,150 |
| 2022 | $1,778 | $23,065 | $5,915 | $17,150 |
| 2021 | $1,762 | $23,070 | $5,920 | $17,150 |
| 2020 | $1,580 | $17,890 | $4,590 | $13,300 |
| 2019 | $1,464 | $51,100 | $13,100 | $38,000 |
| 2018 | $1,459 | $17,890 | $4,590 | $13,300 |
| 2017 | $1,365 | $16,140 | $3,540 | $12,600 |
| 2016 | $1,354 | $16,140 | $3,540 | $12,600 |
| 2015 | -- | $16,140 | $3,540 | $12,600 |
| 2014 | -- | $16,980 | $3,710 | $13,270 |
Source: Public Records
Map
Nearby Homes
- 14315 Viola Ave
- 3922 W 143rd St
- 14513 Mission Rd
- 4046 W 143rd St
- 14434 Cleminshaw Rd
- 14319 Fairlawn Ave
- 14212 Leroy Ave
- 14128 Lakota Ave
- 13921 Wainstead Ave
- 13910 Lyric Ave
- 13818 Courtland Ave
- 13810 Clifford Ave
- 14511 Saint James Ave
- 3746 W 140th St
- 13716 Tyler Ave
- 14018 Parkdale Ave
- 14014 Parkdale Ave
- 13904 Highlandview Ave
- 3739 Warren Rd
- 13514 Tyler Ave
- 3987 W 146th St
- 14509 Courtland Ave
- 3991 W 146th St
- 3979 W 146th St
- 14505 Courtland Ave
- 3975 W 146th St
- 3995 W 146th St
- 14508 Courtland Ave
- 3984 W 146th St
- 3980 W 146th St
- 3992 W 146th St
- 14508 Albrus Ave
- 14504 Courtland Ave
- 4001 W 146th St
- 3971 W 146th St
- 3976 W 146th St
- 14501 Courtland Ave
- 3996 W 146th St
- 14504 Albrus Ave
- 4000 W 146th St