Estimated Value: $2,630,000 - $3,533,000
3
Beds
1
Bath
2,500
Sq Ft
$1,255/Sq Ft
Est. Value
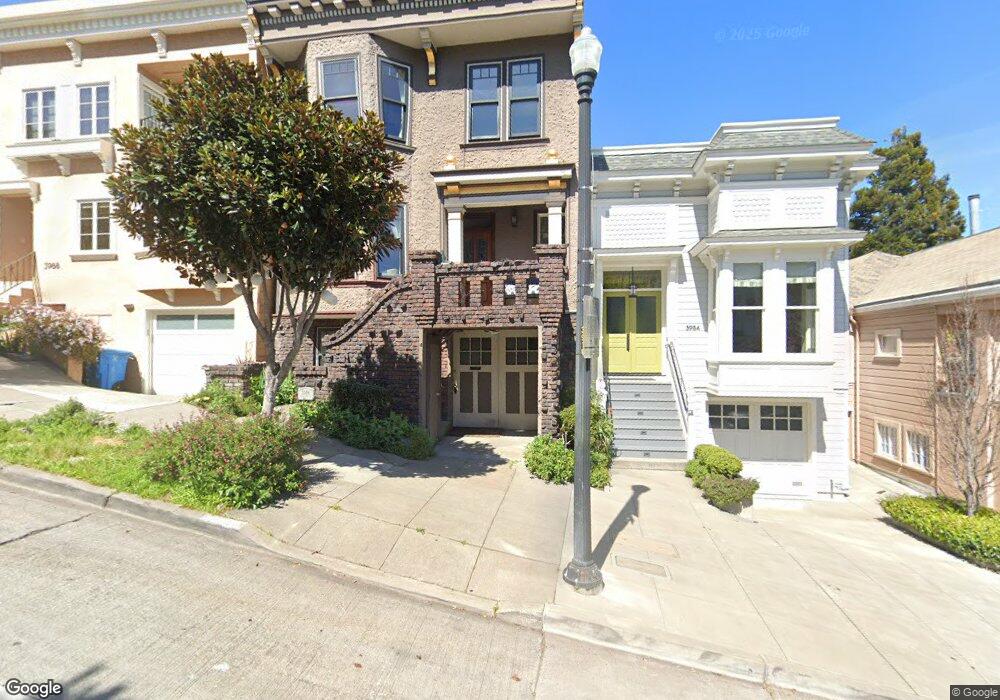
About This Home
This home is located at 3986 20th St, San Francisco, CA 94114 and is currently estimated at $3,136,963, approximately $1,254 per square foot. 3986 20th St is a home located in San Francisco County with nearby schools including Harvey Milk Civil Rights Academy, Everett Middle School, and Thomas Edison Charter Academy.
Ownership History
Date
Name
Owned For
Owner Type
Purchase Details
Closed on
May 22, 1997
Sold by
Avanessian Jano H and Avanessian Rene
Bought by
Avanessian Jano H and Avanessian Rene
Current Estimated Value
Purchase Details
Closed on
Dec 4, 1996
Sold by
Carpenter Paul T Trust and Jo Betty
Bought by
Avanessian Jano H and Avanessian Rene
Home Financials for this Owner
Home Financials are based on the most recent Mortgage that was taken out on this home.
Original Mortgage
$420,000
Outstanding Balance
$42,577
Interest Rate
7.67%
Estimated Equity
$3,094,386
Purchase Details
Closed on
Dec 19, 1995
Sold by
Carpenter Paul T
Bought by
Carpenter Paul T
Purchase Details
Closed on
Nov 8, 1993
Sold by
Carpenter Paul T
Bought by
Carpenter Paul T
Home Financials for this Owner
Home Financials are based on the most recent Mortgage that was taken out on this home.
Original Mortgage
$203,150
Interest Rate
6.91%
Create a Home Valuation Report for This Property
The Home Valuation Report is an in-depth analysis detailing your home's value as well as a comparison with similar homes in the area
Home Values in the Area
Average Home Value in this Area
Purchase History
| Date | Buyer | Sale Price | Title Company |
|---|---|---|---|
| Avanessian Jano H | -- | Fidelity National Title Co | |
| Avanessian Jano H | -- | Fidelity National Title Co | |
| Avanessian Jano H | $525,000 | Fidelity National Title Co | |
| Carpenter Paul T | -- | -- | |
| Carpenter Paul T | -- | Commonwealth Title Company |
Source: Public Records
Mortgage History
| Date | Status | Borrower | Loan Amount |
|---|---|---|---|
| Open | Avanessian Jano H | $420,000 | |
| Previous Owner | Carpenter Paul T | $203,150 |
Source: Public Records
Tax History Compared to Growth
Tax History
| Year | Tax Paid | Tax Assessment Tax Assessment Total Assessment is a certain percentage of the fair market value that is determined by local assessors to be the total taxable value of land and additions on the property. | Land | Improvement |
|---|---|---|---|---|
| 2025 | $9,931 | $855,043 | $594,467 | $260,576 |
| 2024 | $9,931 | $838,278 | $582,811 | $255,467 |
| 2023 | $9,790 | $821,842 | $571,384 | $250,458 |
| 2022 | $10,238 | $805,729 | $560,181 | $245,548 |
| 2021 | $10,055 | $789,932 | $549,198 | $240,734 |
| 2020 | $10,160 | $781,833 | $543,567 | $238,266 |
| 2019 | $9,816 | $766,504 | $532,909 | $233,595 |
| 2018 | $9,483 | $751,475 | $522,460 | $229,015 |
| 2017 | $9,074 | $736,741 | $512,216 | $224,525 |
| 2016 | $8,909 | $722,296 | $502,173 | $220,123 |
| 2015 | $8,796 | $711,447 | $494,630 | $216,817 |
| 2014 | $8,565 | $697,511 | $484,941 | $212,570 |
Source: Public Records
Map
Nearby Homes
- 3960 20th St
- 3939 19th St Unit 3939
- 592 Sanchez St
- 29 Hancock St
- 4106 20th St
- 376 Hill St
- 72-74 Cumberland St
- 785 Dolores St
- 4038 18th St
- 795 Dolores St
- 3747 17th St
- 516 Church St
- 3749 17th St Unit B
- 20-24 Cumberland St
- 892-894 Guerrero St
- 335 Diamond St
- 3879 23rd St
- 3821 23rd St
- 65 Collingwood St Unit 1
- 3451 22nd St
- 3988 20th St
- 3984 20th St
- 3990 20th St
- 3974 20th St
- 3970 20th St
- 677 Sanchez St
- 679 Sanchez St
- 3992 20th St
- 3964 20th St
- 279 Cumberland St Unit 281
- 273 Cumberland St
- 3962 20th St
- 285 Cumberland St
- 289 Cumberland St
- 293 Cumberland St
- 271 Cumberland St
- 271 Cumberland St
- 271 Cumberland St
- 271 Cumberland St
- 271 Cumberland St