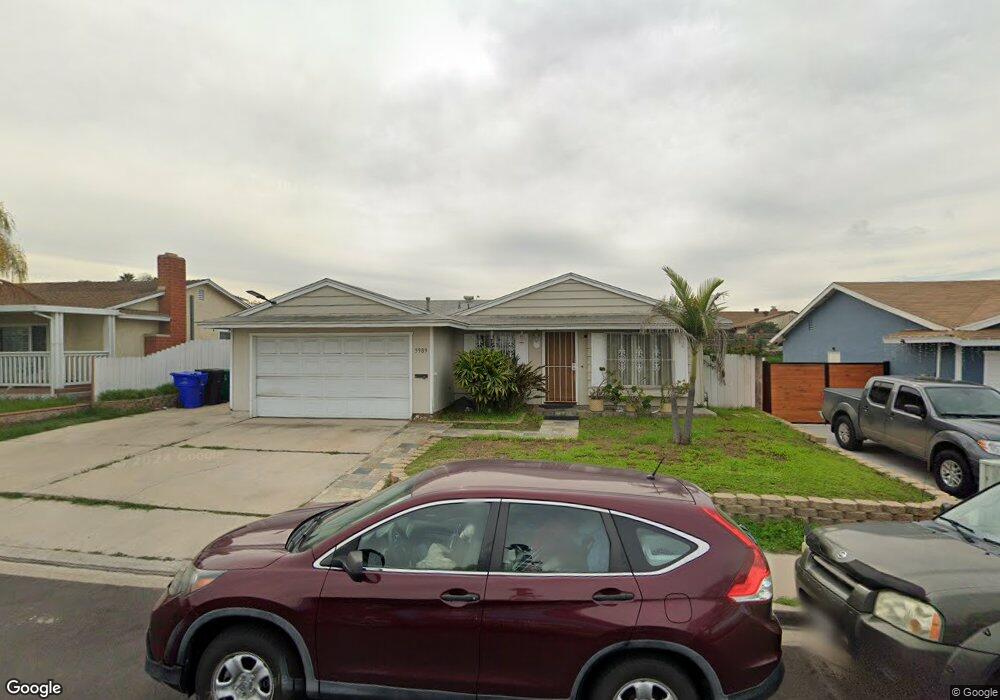
3989 Byrd St San Diego, CA 92154
Otay Mesa West NeighborhoodEstimated Value: $733,509 - $798,000
3
Beds
2
Baths
1,472
Sq Ft
$523/Sq Ft
Est. Value
About This Home
This home is located at 3989 Byrd St, San Diego, CA 92154 and is currently estimated at $769,877, approximately $523 per square foot. 3989 Byrd St is a home located in San Diego County with nearby schools including Myrtle S. Finney Elementary School, Montgomery Middle School, and Montgomery Senior High School.
Ownership History
Date
Name
Owned For
Owner Type
Purchase Details
Closed on
Sep 5, 2002
Sold by
Camaclang Dan T and Camaclang Melba S
Bought by
Uno Gomerciendo R and Uno Lourdes S
Current Estimated Value
Home Financials for this Owner
Home Financials are based on the most recent Mortgage that was taken out on this home.
Original Mortgage
$261,500
Outstanding Balance
$109,078
Interest Rate
6.22%
Estimated Equity
$660,799
Purchase Details
Closed on
Apr 8, 1986
Create a Home Valuation Report for This Property
The Home Valuation Report is an in-depth analysis detailing your home's value as well as a comparison with similar homes in the area
Home Values in the Area
Average Home Value in this Area
Purchase History
| Date | Buyer | Sale Price | Title Company |
|---|---|---|---|
| Uno Gomerciendo R | $285,000 | Fidelity National Title | |
| -- | $87,500 | -- |
Source: Public Records
Mortgage History
| Date | Status | Borrower | Loan Amount |
|---|---|---|---|
| Open | Uno Gomerciendo R | $261,500 |
Source: Public Records
Tax History Compared to Growth
Tax History
| Year | Tax Paid | Tax Assessment Tax Assessment Total Assessment is a certain percentage of the fair market value that is determined by local assessors to be the total taxable value of land and additions on the property. | Land | Improvement |
|---|---|---|---|---|
| 2025 | $4,703 | $412,755 | $188,274 | $224,481 |
| 2024 | $4,703 | $404,663 | $184,583 | $220,080 |
| 2023 | $4,637 | $396,729 | $180,964 | $215,765 |
| 2022 | $4,503 | $388,951 | $177,416 | $211,535 |
| 2021 | $4,397 | $381,326 | $173,938 | $207,388 |
| 2020 | $4,292 | $377,417 | $172,155 | $205,262 |
| 2019 | $4,180 | $370,018 | $168,780 | $201,238 |
| 2018 | $4,114 | $362,764 | $165,471 | $197,293 |
| 2017 | $83 | $355,652 | $162,227 | $193,425 |
| 2016 | $3,931 | $348,680 | $159,047 | $189,633 |
| 2015 | $3,721 | $330,000 | $148,000 | $182,000 |
| 2014 | $3,617 | $320,000 | $144,000 | $176,000 |
Source: Public Records
Map
Nearby Homes
- 4026 Coleman Ave
- 3753 Coleman Ave
- 4205 Rene Dr
- 414 Palm Ave
- 4250 Lemonseed Dr
- 3672 Byrd St
- 3971 Caseman Ave
- 321 Palm Ave
- 823 Fuchsia Ln
- 234 Date St
- 237 Rancho Dr Unit C
- 3965 Otay Valley Rd
- 3470 Robb Roy Place
- 3443 Alonquin Way
- 935 Caleb Ct
- 1185 Ransom St
- 4052 Main St
- 1720 Melrose Ave Unit 27
- 133 Lotus Dr
- 768 Picador Blvd