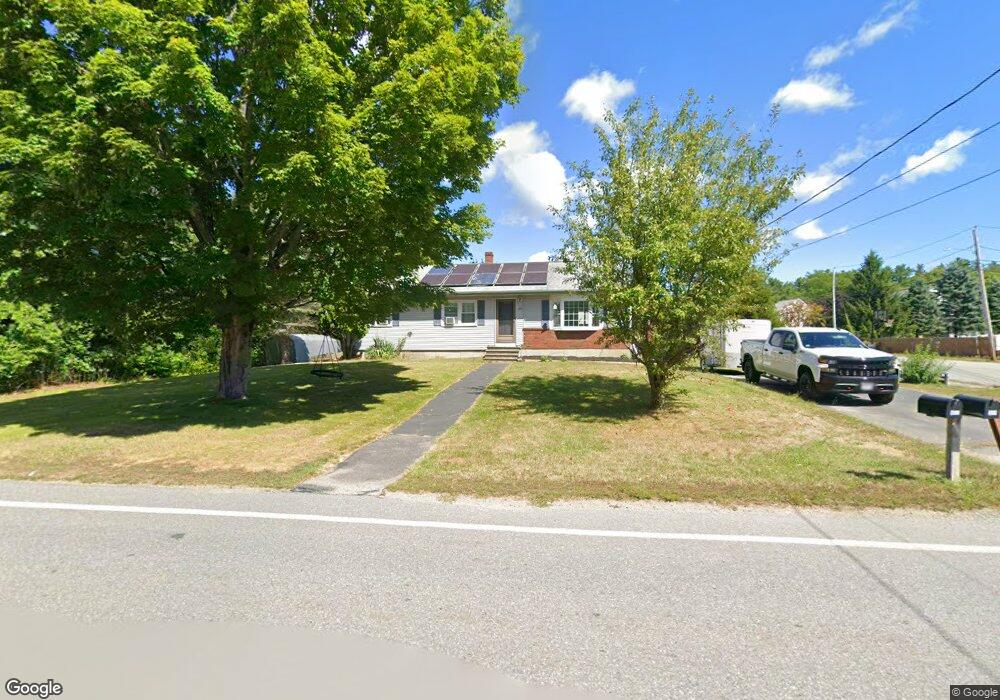
399 Clark St Gardner, MA 01440
Estimated Value: $376,000 - $432,000
3
Beds
1
Bath
1,196
Sq Ft
$333/Sq Ft
Est. Value
About This Home
This home is located at 399 Clark St, Gardner, MA 01440 and is currently estimated at $398,614, approximately $333 per square foot. 399 Clark St is a home located in Worcester County with nearby schools including Gardner High School and Holy Family Academy.
Ownership History
Date
Name
Owned For
Owner Type
Purchase Details
Closed on
May 24, 2006
Sold by
Bourque Claire H and Bourque Leo A
Bought by
Lyon Jennifer
Current Estimated Value
Home Financials for this Owner
Home Financials are based on the most recent Mortgage that was taken out on this home.
Original Mortgage
$173,600
Outstanding Balance
$101,287
Interest Rate
6.53%
Mortgage Type
Purchase Money Mortgage
Estimated Equity
$297,327
Purchase Details
Closed on
Oct 26, 1988
Sold by
Brogan Lynne M
Bought by
A+Bourque Leo
Home Financials for this Owner
Home Financials are based on the most recent Mortgage that was taken out on this home.
Original Mortgage
$50,000
Interest Rate
10.32%
Mortgage Type
Purchase Money Mortgage
Create a Home Valuation Report for This Property
The Home Valuation Report is an in-depth analysis detailing your home's value as well as a comparison with similar homes in the area
Home Values in the Area
Average Home Value in this Area
Purchase History
| Date | Buyer | Sale Price | Title Company |
|---|---|---|---|
| Lyon Jennifer | $217,000 | -- | |
| A+Bourque Leo | $115,000 | -- |
Source: Public Records
Mortgage History
| Date | Status | Borrower | Loan Amount |
|---|---|---|---|
| Open | Lyon Jennifer | $173,600 | |
| Previous Owner | A+Bourque Leo | $48,400 | |
| Previous Owner | A+Bourque Leo | $50,000 |
Source: Public Records
Tax History
| Year | Tax Paid | Tax Assessment Tax Assessment Total Assessment is a certain percentage of the fair market value that is determined by local assessors to be the total taxable value of land and additions on the property. | Land | Improvement |
|---|---|---|---|---|
| 2025 | $47 | $329,900 | $84,100 | $245,800 |
| 2024 | $4,699 | $313,500 | $76,500 | $237,000 |
| 2023 | $4,342 | $269,200 | $75,300 | $193,900 |
| 2022 | $3,986 | $214,400 | $57,000 | $157,400 |
| 2021 | $3,866 | $192,900 | $49,400 | $143,500 |
| 2020 | $3,697 | $187,300 | $49,400 | $137,900 |
| 2019 | $3,490 | $173,300 | $49,400 | $123,900 |
| 2018 | $3,316 | $163,600 | $49,400 | $114,200 |
| 2017 | $3,236 | $158,000 | $49,400 | $108,600 |
| 2016 | $3,089 | $150,900 | $49,400 | $101,500 |
| 2015 | $2,931 | $146,700 | $49,400 | $97,300 |
| 2014 | $2,823 | $149,600 | $55,200 | $94,400 |
Source: Public Records
Map
Nearby Homes
Your Personal Tour Guide
Ask me questions while you tour the home.