Estimated Value: $64,000 - $140,000
2
Beds
1
Bath
1,333
Sq Ft
$70/Sq Ft
Est. Value
About This Home
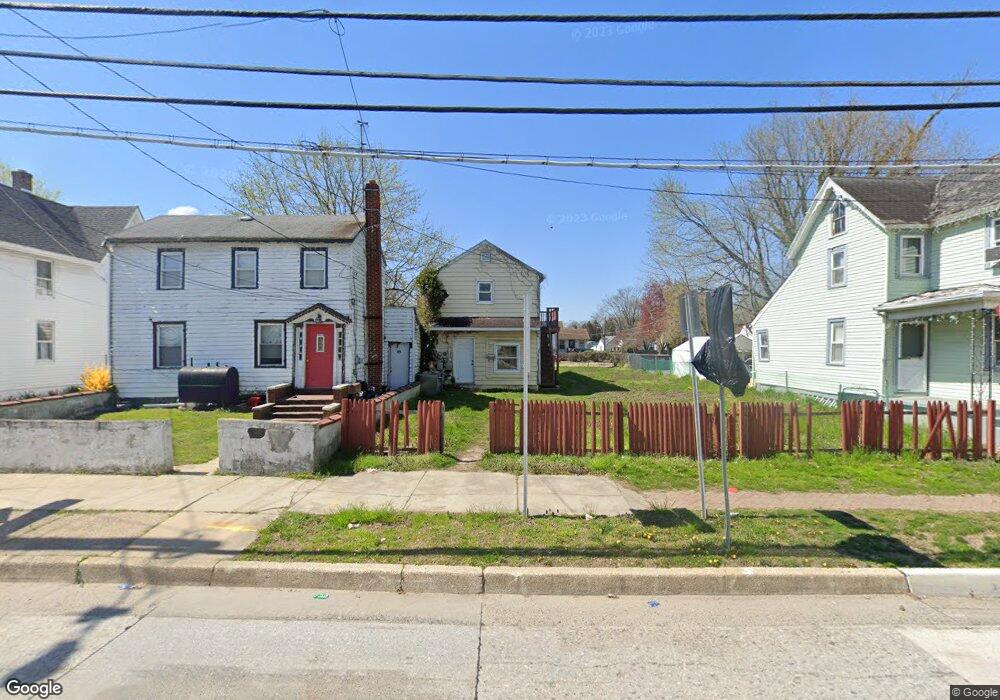
This home is located at 399 E Broadway, Salem, NJ 08079 and is currently estimated at $93,477, approximately $70 per square foot. 399 E Broadway is a home located in Salem County with nearby schools including John Fenwick Elementary School, Salem Middle School, and Salem High School.
Ownership History
Date
Name
Owned For
Owner Type
Purchase Details
Closed on
Dec 2, 2022
Sold by
Nina Khan Llc
Bought by
Best Of 102 Realty Llc
Current Estimated Value
Purchase Details
Closed on
Feb 16, 2017
Sold by
Akrami Shimah
Bought by
Nina Kahn Llc
Purchase Details
Closed on
Dec 30, 2013
Sold by
Royal Tax Lien Services Llc
Bought by
Shandark Goldstar International
Purchase Details
Closed on
Jun 29, 2006
Sold by
Pierce Joseph B
Bought by
Rice Stephen
Purchase Details
Closed on
May 5, 2003
Sold by
L&R Assets Llc
Bought by
Pierce Joseph
Purchase Details
Closed on
Aug 20, 2002
Sold by
Demarco Larraine Jean and Demarco Richard
Bought by
L&R Assets Llc
Purchase Details
Closed on
May 31, 1996
Sold by
Husted Raymond G
Bought by
Demarco Richard and Demarco Lorraine Jean
Create a Home Valuation Report for This Property
The Home Valuation Report is an in-depth analysis detailing your home's value as well as a comparison with similar homes in the area
Home Values in the Area
Average Home Value in this Area
Purchase History
| Date | Buyer | Sale Price | Title Company |
|---|---|---|---|
| Best Of 102 Realty Llc | $25,000 | Salem Oak Title | |
| Best Of 102 Realty Llc | $25,000 | Salem Oak Title | |
| Nina Kahn Llc | -- | Salem Oak Title Agency Inc | |
| Shandark Goldstar International | -- | Royal Crusader | |
| Rice Stephen | $20,000 | Intercoastal Title Agency In | |
| Pierce Joseph | $15,000 | Intercoastal Title Agency In | |
| L&R Assets Llc | -- | -- | |
| Demarco Richard | -- | -- |
Source: Public Records
Tax History Compared to Growth
Tax History
| Year | Tax Paid | Tax Assessment Tax Assessment Total Assessment is a certain percentage of the fair market value that is determined by local assessors to be the total taxable value of land and additions on the property. | Land | Improvement |
|---|---|---|---|---|
| 2025 | $2,220 | $27,000 | $5,800 | $21,200 |
| 2024 | $2,122 | $27,000 | $5,800 | $21,200 |
| 2023 | $2,122 | $27,000 | $5,800 | $21,200 |
| 2022 | $2,030 | $27,000 | $5,800 | $21,200 |
| 2021 | $1,960 | $27,000 | $5,800 | $21,200 |
| 2020 | $1,920 | $27,000 | $5,800 | $21,200 |
| 2019 | $1,909 | $27,000 | $5,800 | $21,200 |
| 2018 | $1,867 | $27,000 | $5,800 | $21,200 |
| 2017 | $1,844 | $27,000 | $5,800 | $21,200 |
| 2016 | $1,574 | $40,200 | $15,700 | $24,500 |
| 2015 | $1,554 | $40,200 | $15,700 | $24,500 |
| 2014 | $1,546 | $40,200 | $15,700 | $24,500 |
Source: Public Records
Map
Nearby Homes
- 401 E Broadway
- 395 E Broadway
- 403 E Broadway
- 393 E Broadway
- 405 E Broadway
- 406 E Broadway Unit 410
- 389 E Broadway
- 385 387 E Broadway
- 387 E Broadway
- 385 E Broadway Unit 387
- 392 E Broadway
- 9 Davis Ave
- 383 E Broadway
- 14 Davis Ave
- 363 Keasbey St
- 382 E Broadway
- 382 E Broadway Unit 1
- 382 UNIT 1 E Broadway
- 382 E Broadway Unit A
- 382 E Broadway Unit B