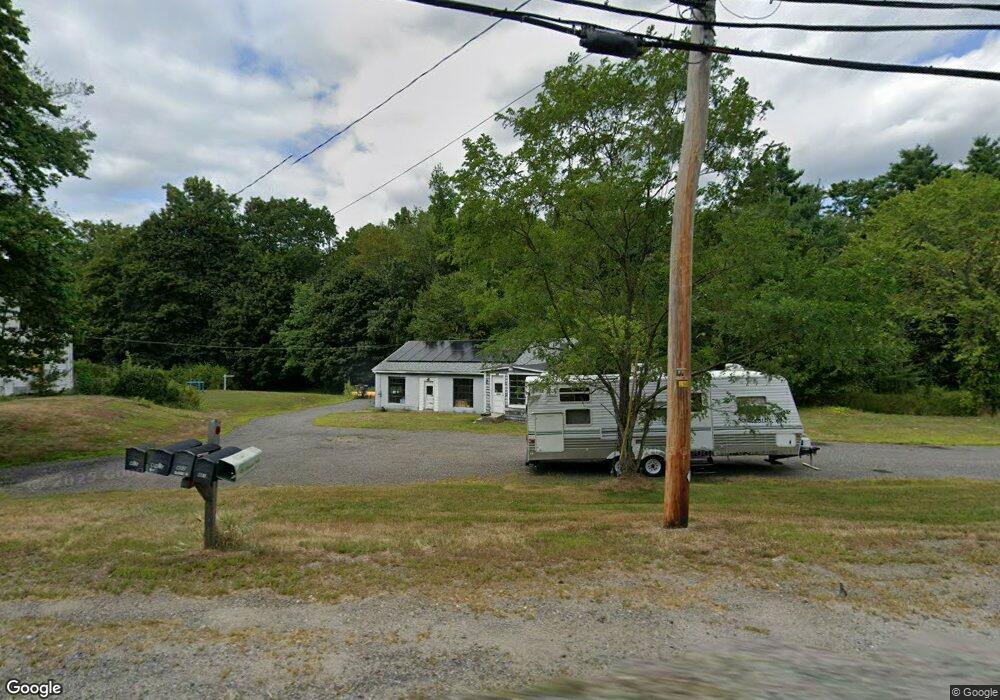
399 Main St Townsend, MA 01474
Estimated Value: $695,683
Studio
--
Bath
3,694
Sq Ft
$188/Sq Ft
Est. Value
About This Home
This home is located at 399 Main St, Townsend, MA 01474 and is currently priced at $695,683, approximately $188 per square foot. 399 Main St is a home located in Middlesex County with nearby schools including North Middlesex Regional High School.
Ownership History
Date
Name
Owned For
Owner Type
Purchase Details
Closed on
Mar 14, 2025
Sold by
Duggan Terry and Duggan Philip T
Bought by
Goldsmith Stephen and Inoa Tiffany
Current Estimated Value
Home Financials for this Owner
Home Financials are based on the most recent Mortgage that was taken out on this home.
Original Mortgage
$350,000
Outstanding Balance
$346,511
Interest Rate
6.63%
Mortgage Type
Purchase Money Mortgage
Purchase Details
Closed on
May 14, 1997
Sold by
Patten John
Bought by
Duggan Philip and Duggan Terry L
Home Financials for this Owner
Home Financials are based on the most recent Mortgage that was taken out on this home.
Original Mortgage
$156,953
Interest Rate
8.12%
Mortgage Type
Commercial
Create a Home Valuation Report for This Property
The Home Valuation Report is an in-depth analysis detailing your home's value as well as a comparison with similar homes in the area
Home Values in the Area
Average Home Value in this Area
Purchase History
| Date | Buyer | Sale Price | Title Company |
|---|---|---|---|
| Goldsmith Stephen | $370,000 | None Available | |
| Goldsmith Stephen | $370,000 | None Available | |
| Duggan Philip | $160,000 | -- | |
| Duggan Philip T | $160,000 | -- |
Source: Public Records
Mortgage History
| Date | Status | Borrower | Loan Amount |
|---|---|---|---|
| Open | Goldsmith Stephen | $350,000 | |
| Closed | Goldsmith Stephen | $350,000 | |
| Previous Owner | Duggan Philip T | $156,953 |
Source: Public Records
Tax History
| Year | Tax Paid | Tax Assessment Tax Assessment Total Assessment is a certain percentage of the fair market value that is determined by local assessors to be the total taxable value of land and additions on the property. | Land | Improvement |
|---|---|---|---|---|
| 2025 | $2,208 | $152,100 | $102,400 | $49,700 |
| 2024 | $2,192 | $152,100 | $102,400 | $49,700 |
| 2023 | $2,135 | $139,900 | $93,800 | $46,100 |
| 2022 | $2,464 | $139,900 | $93,800 | $46,100 |
| 2021 | $7,674 | $139,900 | $93,800 | $46,100 |
| 2020 | $7,213 | $135,300 | $93,800 | $41,500 |
| 2019 | $3,932 | $135,300 | $93,800 | $41,500 |
| 2018 | $4,897 | $127,300 | $90,400 | $36,900 |
| 2017 | $2,469 | $125,500 | $90,400 | $35,100 |
| 2016 | $2,485 | $125,500 | $90,400 | $35,100 |
| 2015 | $2,398 | $125,500 | $90,400 | $35,100 |
| 2014 | $2,399 | $122,600 | $92,100 | $30,500 |
Source: Public Records
Map
Nearby Homes
- 9 Kaneohe Ct
- 86 W Elm Lunenburg Rd Blood Rd
- 1 W Meadow Rd
- 16 Worcester Rd
- 5 Turnpike Rd Unit 213 TWO
- 2 W Meadow Rd
- 1 Depot Street Extension Unit 3
- 1 Depot Street Extension Unit 5
- 1 Depot Street Extension Unit 2
- 1 Depot Street Extension Unit 4
- 43 Greenville Rd
- 8 Old Meetinghouse Rd
- 0 Brookline St
- 0 Tyler Rd Unit 72560808
- 00 Tyler Rd
- 1578 Greenville Rd
- 481 W Townsend Rd
- 637 Mason Rd
- 18 Beech St
- 7 Balsam Dr
Your Personal Tour Guide
Ask me questions while you tour the home.