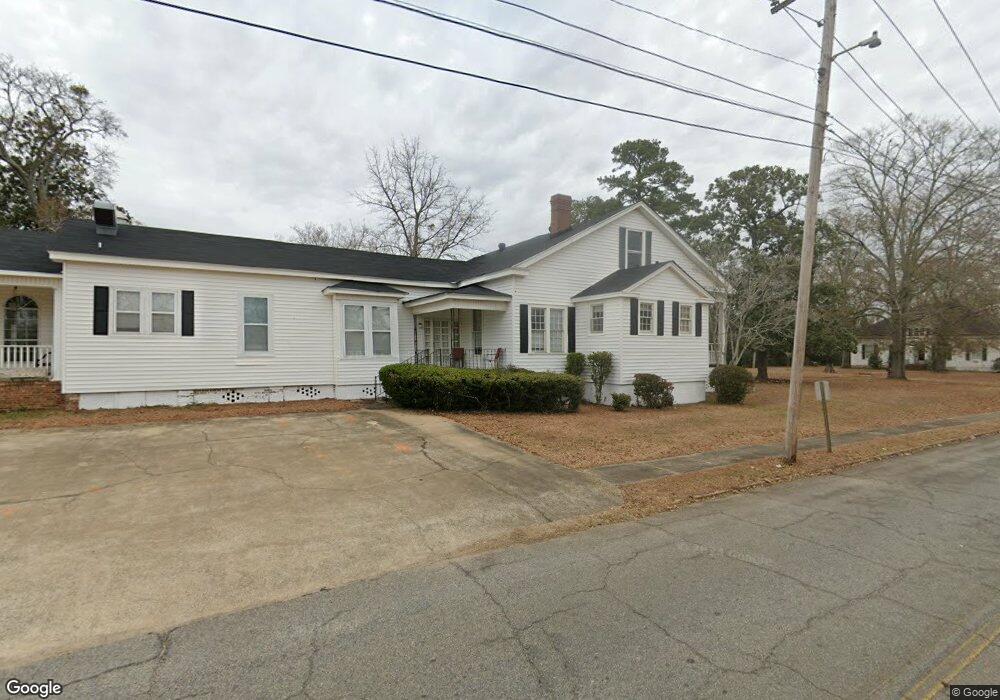
399 N Main St Blakely, GA 39823
Estimated Value: $378,000 - $396,931
--
Bed
12
Baths
7,249
Sq Ft
$53/Sq Ft
Est. Value
About This Home
This home is located at 399 N Main St, Blakely, GA 39823 and is currently estimated at $387,466, approximately $53 per square foot. 399 N Main St is a home located in Early County with nearby schools including Early County Elementary School, Early County Middle School, and Early County High School.
Ownership History
Date
Name
Owned For
Owner Type
Purchase Details
Closed on
Apr 24, 2019
Sold by
Hardin Family Partnership Lllp
Bought by
Anchor Of Hope House Llc
Current Estimated Value
Purchase Details
Closed on
Dec 16, 2012
Sold by
Hardin John Christopher
Bought by
Hardin Fam Partnership Lllp
Purchase Details
Closed on
Mar 23, 1994
Bought by
Hardin John Christop
Create a Home Valuation Report for This Property
The Home Valuation Report is an in-depth analysis detailing your home's value as well as a comparison with similar homes in the area
Home Values in the Area
Average Home Value in this Area
Purchase History
| Date | Buyer | Sale Price | Title Company |
|---|---|---|---|
| Anchor Of Hope House Llc | -- | -- | |
| Hardin Fam Partnership Lllp | -- | -- | |
| Hardin John Christop | $79,300 | -- |
Source: Public Records
Tax History Compared to Growth
Tax History
| Year | Tax Paid | Tax Assessment Tax Assessment Total Assessment is a certain percentage of the fair market value that is determined by local assessors to be the total taxable value of land and additions on the property. | Land | Improvement |
|---|---|---|---|---|
| 2024 | $4,074 | $131,904 | $6,000 | $125,904 |
| 2023 | $3,556 | $131,904 | $6,000 | $125,904 |
| 2022 | $3,177 | $125,961 | $6,000 | $119,961 |
| 2021 | $2,751 | $108,021 | $6,000 | $102,021 |
| 2020 | $2,699 | $108,021 | $6,000 | $102,021 |
| 2019 | $2,783 | $108,195 | $6,000 | $102,195 |
| 2018 | $3,243 | $108,195 | $6,000 | $102,195 |
| 2017 | $3,246 | $108,195 | $6,000 | $102,195 |
| 2016 | $2,935 | $98,153 | $6,000 | $92,153 |
| 2015 | -- | $98,109 | $6,000 | $92,110 |
| 2014 | -- | $98,110 | $6,000 | $92,110 |
| 2013 | -- | $99,956 | $6,000 | $93,956 |
Source: Public Records
Map
Nearby Homes
- 337 College St
- 21 E Railroad Ln
- 0000 Martin Luther King Junior Blvd
- 234 College St
- 76 S Jefferson Ave
- 1827 Tarver Dr
- 73 W Westward Ave
- Stein Rd
- 115 S Central Ave
- 000 Georgia 62
- 73 Grove Place
- 182 S Central Ave
- 600 Chattahoochee Ave
- 16 Woodlawn Dr
- 556 Flowers Dr
- 00 N Woodlawn Dr
- 8 Lots Unknown Ln
- 507 Lakewood Dr
- 74 S Lancelot St
- 18802 E South Blvd