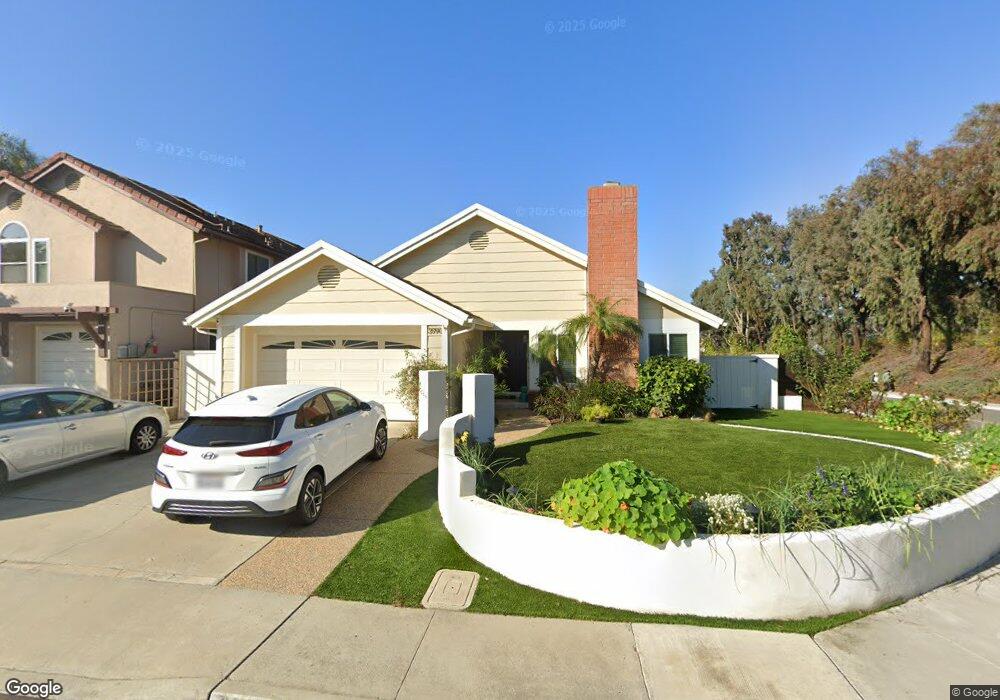
3990 San Leandro Way San Diego, CA 92130
Carmel Valley NeighborhoodEstimated Value: $1,702,646 - $1,998,000
3
Beds
2
Baths
1,821
Sq Ft
$1,024/Sq Ft
Est. Value
About This Home
This home is located at 3990 San Leandro Way, San Diego, CA 92130 and is currently estimated at $1,863,912, approximately $1,023 per square foot. 3990 San Leandro Way is a home located in San Diego County with nearby schools including Carmel Del Mar Elementary School, Carmel Valley Middle School, and Torrey Pines High School.
Ownership History
Date
Name
Owned For
Owner Type
Purchase Details
Closed on
Feb 17, 2021
Sold by
Zick Kevin R
Bought by
Zick Kevin R and Kevin R Zick Trust
Current Estimated Value
Home Financials for this Owner
Home Financials are based on the most recent Mortgage that was taken out on this home.
Original Mortgage
$383,000
Outstanding Balance
$342,255
Interest Rate
2.65%
Mortgage Type
New Conventional
Estimated Equity
$1,521,657
Purchase Details
Closed on
Oct 9, 2019
Sold by
Zick Kevin R
Bought by
Zick Kevin R and Kevin R Zick Trust
Home Financials for this Owner
Home Financials are based on the most recent Mortgage that was taken out on this home.
Original Mortgage
$385,000
Interest Rate
3.5%
Mortgage Type
New Conventional
Purchase Details
Closed on
May 6, 2015
Sold by
Zick Kevin R
Bought by
Zick Kevin R
Home Financials for this Owner
Home Financials are based on the most recent Mortgage that was taken out on this home.
Original Mortgage
$25,000
Interest Rate
3.64%
Mortgage Type
Credit Line Revolving
Purchase Details
Closed on
Jul 19, 2005
Sold by
Zick Kevin R
Bought by
Zick Kevin R
Home Financials for this Owner
Home Financials are based on the most recent Mortgage that was taken out on this home.
Original Mortgage
$500,000
Interest Rate
5.25%
Mortgage Type
Purchase Money Mortgage
Purchase Details
Closed on
Jun 8, 2005
Sold by
Zick Kevin R
Bought by
Zick Kevin R
Home Financials for this Owner
Home Financials are based on the most recent Mortgage that was taken out on this home.
Original Mortgage
$500,000
Interest Rate
5.25%
Mortgage Type
Purchase Money Mortgage
Purchase Details
Closed on
Feb 24, 2004
Sold by
Zick Kevin R and Zick Kimberly C
Bought by
Zick Kevin R
Home Financials for this Owner
Home Financials are based on the most recent Mortgage that was taken out on this home.
Original Mortgage
$504,000
Interest Rate
4.25%
Mortgage Type
New Conventional
Purchase Details
Closed on
Jan 29, 2002
Sold by
Zick Kevin R and Zick Kimberly C
Bought by
Zick Kevin R and Zick Kimberly C
Home Financials for this Owner
Home Financials are based on the most recent Mortgage that was taken out on this home.
Original Mortgage
$354,000
Interest Rate
4.75%
Purchase Details
Closed on
Jan 6, 2000
Sold by
Locatelli Sharon D
Bought by
Zick Kevin R and Zick Kimberly C
Home Financials for this Owner
Home Financials are based on the most recent Mortgage that was taken out on this home.
Original Mortgage
$300,000
Interest Rate
8.16%
Mortgage Type
Balloon
Purchase Details
Closed on
May 20, 1985
Create a Home Valuation Report for This Property
The Home Valuation Report is an in-depth analysis detailing your home's value as well as a comparison with similar homes in the area
Home Values in the Area
Average Home Value in this Area
Purchase History
| Date | Buyer | Sale Price | Title Company |
|---|---|---|---|
| Zick Kevin R | -- | Accommodation | |
| Zick Kevin R | -- | Fidelity National Title Co | |
| Zick Kevin R | -- | Fidelity National Title | |
| Zick Kevin R | -- | Fidelity National Title | |
| Zick Kevin R | -- | Accommodation | |
| Zick Kevin R | -- | Stewart Title | |
| Zick Kevin R | -- | -- | |
| Zick Kevin R | -- | Fidelity National Title Co | |
| Zick Kevin R | -- | -- | |
| Zick Kevin R | -- | Fidelity National Title Co | |
| Zick Kevin R | -- | Fidelity National Title Co | |
| Zick Kevin R | $375,000 | Commonwealth Land Title Co | |
| -- | $167,500 | -- |
Source: Public Records
Mortgage History
| Date | Status | Borrower | Loan Amount |
|---|---|---|---|
| Open | Zick Kevin R | $383,000 | |
| Closed | Zick Kevin R | $385,000 | |
| Closed | Zick Kevin R | $25,000 | |
| Closed | Zick Kevin R | $500,000 | |
| Closed | Zick Kevin R | $504,000 | |
| Closed | Zick Kevin R | $354,000 | |
| Previous Owner | Zick Kevin R | $300,000 | |
| Closed | Zick Kevin R | $37,500 |
Source: Public Records
Tax History Compared to Growth
Tax History
| Year | Tax Paid | Tax Assessment Tax Assessment Total Assessment is a certain percentage of the fair market value that is determined by local assessors to be the total taxable value of land and additions on the property. | Land | Improvement |
|---|---|---|---|---|
| 2025 | $6,222 | $576,348 | $361,178 | $215,170 |
| 2024 | $6,222 | $565,048 | $354,097 | $210,951 |
| 2023 | $6,077 | $553,969 | $347,154 | $206,815 |
| 2022 | $5,963 | $543,108 | $340,348 | $202,760 |
| 2021 | $5,749 | $532,460 | $333,675 | $198,785 |
| 2020 | $5,798 | $527,001 | $330,254 | $196,747 |
| 2019 | $5,686 | $516,669 | $323,779 | $192,890 |
| 2018 | $5,443 | $506,539 | $317,431 | $189,108 |
| 2017 | $81 | $496,607 | $311,207 | $185,400 |
| 2016 | $5,171 | $486,870 | $305,105 | $181,765 |
| 2015 | $5,095 | $479,558 | $300,523 | $179,035 |
| 2014 | $4,994 | $470,165 | $294,637 | $175,528 |
Source: Public Records
Map
Nearby Homes
- 3975 San Gregorio Way
- 3714 Carmel View Rd
- 12550 Carmel Creek Rd Unit 100
- 12233 Caminito Del Mar Sands
- 12165 Caminito Mira Del Mar
- 4049 Carmel View Rd Unit 74
- 4049 Carmel View Rd Unit 75
- 3672 Caminito Carmel Landing
- 12370 Carmel Country Rd Unit 202
- 12372 Carmel Country Rd Unit 207
- 12372 Carmel Country Rd Unit 202
- 12368 Carmel Country Rd Unit 303
- 3686 Ruette de Ville
- 12364 Carmel Country Rd Unit C306
- 12585 Ruette Alliante Unit 152
- 3718 Mykonos Ln Unit 158
- 12213 Carmel Vista Rd Unit 234
- 3965 Via Holgura
- 11649 Thistle Hill Place
- 3545 Caminito el Rincon Unit 237
- 3980 San Leandro Way
- 3995 Saint Agnes Ct
- 3970 San Leandro Way
- 3985 Saint Agnes Ct
- 3995 San Leandro Way
- 3975 Saint Agnes Ct
- 3985 San Leandro Way
- 3960 San Leandro Way
- 3975 San Leandro Way
- 3965 Saint Agnes Ct
- 3965 San Leandro Way
- 3950 San Leandro Way
- 3990 San Gregorio Way
- 3955 San Leandro Way
- 3980 San Gregorio Way
- 3998 Saint Agnes Ct
- 3955 Saint Agnes Ct
- 3970 San Gregorio Way
- 3970 Saint Agnes Ct
- 3930 San Leandro Way