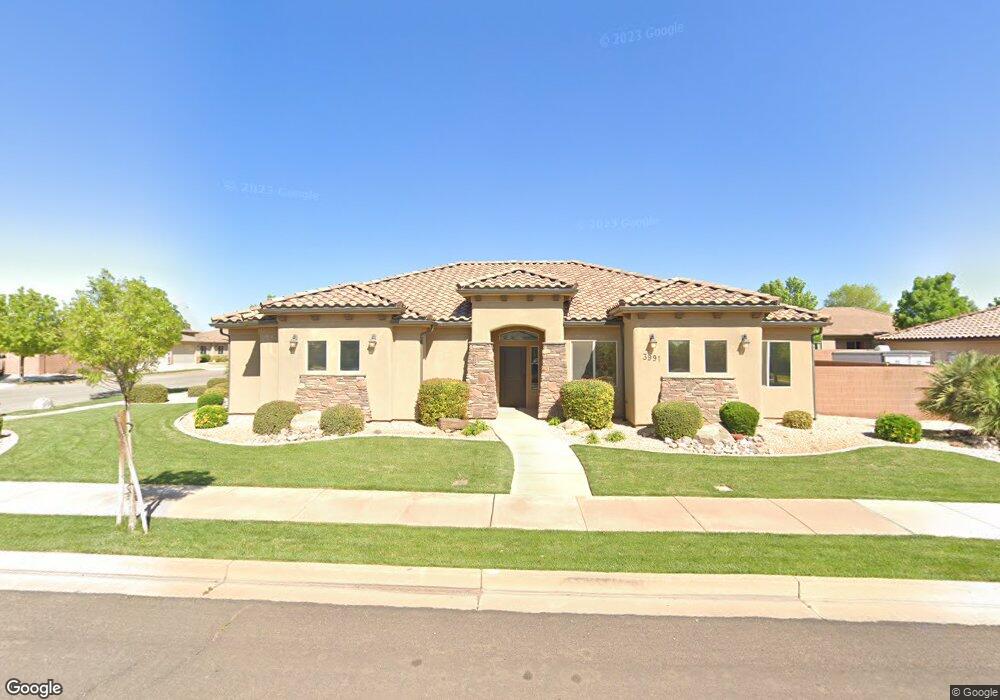
3991 S 20 E St. George, UT 84790
Estimated Value: $573,000 - $634,000
4
Beds
2
Baths
2,008
Sq Ft
$298/Sq Ft
Est. Value
About This Home
This home is located at 3991 S 20 E, St. George, UT 84790 and is currently estimated at $599,205, approximately $298 per square foot. 3991 S 20 E is a home located in Washington County with nearby schools including Majestic Fields School, Crimson Cliffs Middle School, and Washington Fields Intermediate School.
Ownership History
Date
Name
Owned For
Owner Type
Purchase Details
Closed on
Feb 22, 2023
Sold by
Clarke Wesley J
Bought by
Clarke Living Trust
Current Estimated Value
Purchase Details
Closed on
Nov 2, 2020
Sold by
Wilcox Randy and Wilcox Melinda
Bought by
Clarke Wesley J and Clarke Ellen
Purchase Details
Closed on
Jun 17, 2020
Sold by
Treasure Valley Homeowners Association
Bought by
Washington City
Purchase Details
Closed on
Jul 22, 2011
Sold by
Tobler Homes Inc
Bought by
Wilcox Randy and Wilcox Melinda
Home Financials for this Owner
Home Financials are based on the most recent Mortgage that was taken out on this home.
Original Mortgage
$55,000
Interest Rate
4.45%
Mortgage Type
New Conventional
Purchase Details
Closed on
Oct 29, 2010
Sold by
Washington Management Llc
Bought by
Tobler Homes Inc
Create a Home Valuation Report for This Property
The Home Valuation Report is an in-depth analysis detailing your home's value as well as a comparison with similar homes in the area
Purchase History
| Date | Buyer | Sale Price | Title Company |
|---|---|---|---|
| Clarke Living Trust | -- | -- | |
| Clarke Wesley J | -- | Southern Utah Title Co | |
| Washington City | -- | None Available | |
| Wilcox Randy | -- | Southern Utah Title | |
| Tobler Homes Inc | -- | Southern Utah Title |
Source: Public Records
Mortgage History
| Date | Status | Borrower | Loan Amount |
|---|---|---|---|
| Previous Owner | Wilcox Randy | $55,000 |
Source: Public Records
Tax History Compared to Growth
Tax History
| Year | Tax Paid | Tax Assessment Tax Assessment Total Assessment is a certain percentage of the fair market value that is determined by local assessors to be the total taxable value of land and additions on the property. | Land | Improvement |
|---|---|---|---|---|
| 2025 | $2,207 | $331,485 | $79,750 | $251,735 |
| 2023 | $2,295 | $344,410 | $82,500 | $261,910 |
| 2022 | $2,518 | $355,575 | $77,000 | $278,575 |
| 2021 | $2,066 | $433,800 | $100,000 | $333,800 |
| 2020 | $1,886 | $374,600 | $85,000 | $289,600 |
| 2019 | $1,768 | $342,900 | $75,000 | $267,900 |
| 2018 | $1,718 | $172,260 | $0 | $0 |
| 2017 | $1,749 | $170,610 | $0 | $0 |
| 2016 | $1,728 | $156,090 | $0 | $0 |
| 2015 | $1,733 | $150,590 | $0 | $0 |
| 2014 | $1,682 | $147,180 | $0 | $0 |
Source: Public Records
Map
Nearby Homes
- 3906 S Kennedy Ln Unit 127
- 3882 S Kennedy Ln Unit 126
- 3882 S Kennedy Ln
- 4087 S Signature Way
- 2143 W 3930 S Unit Lot 23
- 2143 W 3930 S
- 2144 W 3930 S Unit 21
- 3858 S Kennedy Ln Unit 125
- 3842 S Kennedy Ln Unit 124
- 3792 S Kennedy Ln
- 3761 S Kennedy Ln Unit 134
- 3736 S Mckenzie Ln Unit 140
- 3701 S Mckenzie Ln
- 3920 S Steeplechase Rd
- 283 Blue Quartz Dr
- 3465 E 2090 Cir S
- Lot 32 the Reserve at Old Farm
- 3673 S Cannon Way
- 501 E Tincup Ln Unit 31
- 501 E Tincup Ln
- 4011 S 20 E #16
- 4011 S 20 E
- 3990 Priceless Way
- 3959 S 20 E
- 4032 S 20 E #5
- 3990 S 20 E
- 4012 Priceless Way
- 63 E Gold Bullion Way
- 4010 S 20 E
- 3966 S 20 E
- 4031 S 20 E
- 63 E Treasure Valley Rd
- 83 E Gold Bullion Way
- 3945 S 20 E
- 3931 S 20 E
- 94 Gold Bullion Way
- 3991 S Priceless Way
- 3991 S Priceless Way
- 4032 S 20 E
- 3946 S 20 E