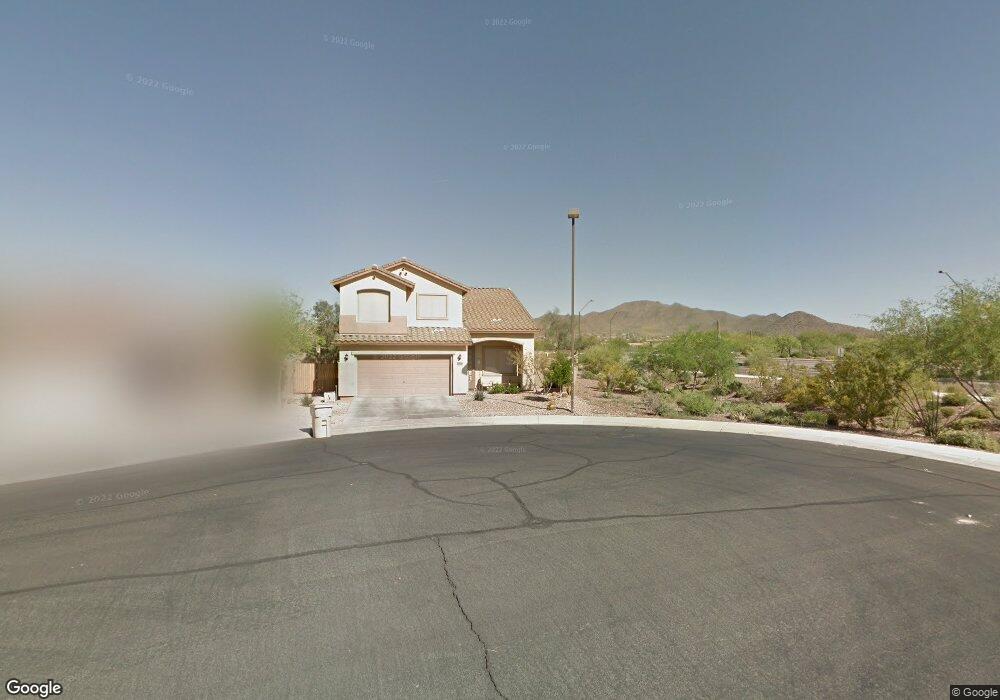
39918 N La Cantera Ct Phoenix, AZ 85086
Estimated Value: $513,000 - $593,000
4
Beds
3
Baths
2,168
Sq Ft
$248/Sq Ft
Est. Value
About This Home
This home is located at 39918 N La Cantera Ct, Phoenix, AZ 85086 and is currently estimated at $536,858, approximately $247 per square foot. 39918 N La Cantera Ct is a home located in Maricopa County with nearby schools including Diamond Canyon Elementary School, Boulder Creek High School, and Caurus Academy.
Ownership History
Date
Name
Owned For
Owner Type
Purchase Details
Closed on
Dec 20, 2018
Sold by
Gray Elizabeth
Bought by
Tejeda Thomas and Tejeda Stephanie Sarah
Current Estimated Value
Home Financials for this Owner
Home Financials are based on the most recent Mortgage that was taken out on this home.
Original Mortgage
$232,000
Interest Rate
4.6%
Mortgage Type
New Conventional
Purchase Details
Closed on
Feb 25, 2011
Sold by
Baradic David A and Baradic An M
Bought by
Gray Elizabeth
Purchase Details
Closed on
Jul 12, 2005
Sold by
Del Webbs Coventry Homes Inc
Bought by
Baradic David A and Baradic Ann M
Home Financials for this Owner
Home Financials are based on the most recent Mortgage that was taken out on this home.
Original Mortgage
$246,064
Interest Rate
5.75%
Mortgage Type
Purchase Money Mortgage
Create a Home Valuation Report for This Property
The Home Valuation Report is an in-depth analysis detailing your home's value as well as a comparison with similar homes in the area
Home Values in the Area
Average Home Value in this Area
Purchase History
| Date | Buyer | Sale Price | Title Company |
|---|---|---|---|
| Tejeda Thomas | $290,000 | First American Title Insuran | |
| Gray Elizabeth | $140,100 | Pioneer Title Agency Inc | |
| Baradic David A | $307,580 | Sun Title Agency Co | |
| Del Webbs Coventry Homes Inc | -- | Sun Title Agency Co |
Source: Public Records
Mortgage History
| Date | Status | Borrower | Loan Amount |
|---|---|---|---|
| Previous Owner | Tejeda Thomas | $232,000 | |
| Previous Owner | Baradic David A | $246,064 | |
| Closed | Baradic David A | $46,137 |
Source: Public Records
Tax History
| Year | Tax Paid | Tax Assessment Tax Assessment Total Assessment is a certain percentage of the fair market value that is determined by local assessors to be the total taxable value of land and additions on the property. | Land | Improvement |
|---|---|---|---|---|
| 2025 | $3,011 | $27,939 | -- | -- |
| 2024 | $2,822 | $26,608 | -- | -- |
| 2023 | $2,822 | $38,580 | $7,710 | $30,870 |
| 2022 | $2,696 | $28,620 | $5,720 | $22,900 |
| 2021 | $2,777 | $27,320 | $5,460 | $21,860 |
| 2020 | $2,716 | $24,930 | $4,980 | $19,950 |
| 2019 | $2,665 | $23,770 | $4,750 | $19,020 |
| 2018 | $2,580 | $22,760 | $4,550 | $18,210 |
| 2017 | $2,530 | $21,550 | $4,310 | $17,240 |
| 2016 | $2,169 | $21,320 | $4,260 | $17,060 |
| 2015 | $2,105 | $19,870 | $3,970 | $15,900 |
Source: Public Records
Map
Nearby Homes
- 0 N 9th Ave Unit 6524872
- 1608 W Kuralt Dr Unit 55
- 1708 W Twain Ct
- 1623 W Owens Way
- 39617 N Prairie Ln Unit 55
- 1730 W Hemingway Ln
- 40010 N Candlewyck Ln
- 40130 N Thunder Hills Ct Unit 32
- 1676 W Owens Way
- 1743 W Owens Way Unit 32
- 1651 W Morse Dr
- 39508 N Prairie Ln Unit 55
- 1626 W Morse Dr Unit 32
- 1779 W Owens Way Unit 32
- 1780 W Morse Dr Unit 32
- 40309 N La Cantera Ct
- 1795 W Morse Dr
- 1704 W Dion Dr
- 1610 W Ainsworth Dr Unit 30
- 1842 W St Exupery Dr Unit 53
- 39912 N La Cantera Ct
- 39931 N Bell Meadow Trail
- 39906 N La Cantera Ct
- 39925 N Bell Meadow Trail
- 39919 N Bell Meadow Trail
- 39828 N La Cantera Ct
- 39913 N Bell Meadow Trail Unit 55
- 39907 N Bell Meadow Trail
- 39822 N La Cantera Ct Unit 55
- 39831 N La Cantera Ct
- 39821 N Bell Meadow Trail
- 39825 N La Cantera Ct
- 39816 N La Cantera Ct
- 39819 N La Cantera Ct Unit 55
- 39815 N Bell Meadow Trail
- 39928 N Bell Meadow Trail
- 39934 N Bell Meadow Trail
- 39922 N Bell Meadow Trail
- 39940 N Bell Meadow Trail
- 39916 N Bell Meadow Trail