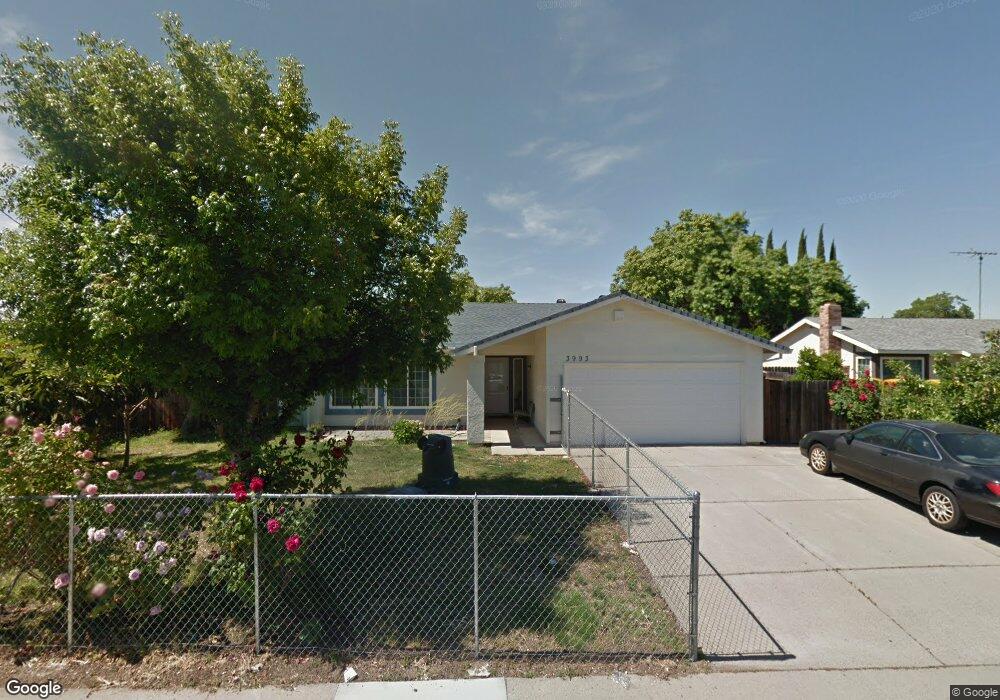
3993 Deer Cross Way Sacramento, CA 95823
North Laguna NeighborhoodEstimated Value: $295,000 - $421,458
3
Beds
2
Baths
1,290
Sq Ft
$291/Sq Ft
Est. Value
About This Home
This home is located at 3993 Deer Cross Way, Sacramento, CA 95823 and is currently estimated at $375,115, approximately $290 per square foot. 3993 Deer Cross Way is a home located in Sacramento County with nearby schools including Union House Elementary School, Samuel Jackman Middle School, and Valley High School.
Ownership History
Date
Name
Owned For
Owner Type
Purchase Details
Closed on
Jan 7, 2009
Sold by
Downey Savings & Loan Association Fa
Bought by
Khorn Diana and Ouk Khorn
Current Estimated Value
Home Financials for this Owner
Home Financials are based on the most recent Mortgage that was taken out on this home.
Original Mortgage
$110,458
Interest Rate
4.92%
Mortgage Type
FHA
Purchase Details
Closed on
Jun 17, 2008
Sold by
Valencia Abraham
Bought by
Downey Sla Fa
Purchase Details
Closed on
Nov 10, 2004
Sold by
Reid June
Bought by
Valencia Abraham
Home Financials for this Owner
Home Financials are based on the most recent Mortgage that was taken out on this home.
Original Mortgage
$232,000
Interest Rate
6.97%
Mortgage Type
Purchase Money Mortgage
Purchase Details
Closed on
May 10, 2000
Sold by
Williams Gregory and Williams Diana J
Bought by
Reid June
Home Financials for this Owner
Home Financials are based on the most recent Mortgage that was taken out on this home.
Original Mortgage
$94,390
Interest Rate
8.22%
Mortgage Type
FHA
Create a Home Valuation Report for This Property
The Home Valuation Report is an in-depth analysis detailing your home's value as well as a comparison with similar homes in the area
Home Values in the Area
Average Home Value in this Area
Purchase History
| Date | Buyer | Sale Price | Title Company |
|---|---|---|---|
| Khorn Diana | $100,000 | Lawyers Title | |
| Downey Sla Fa | $105,000 | None Available | |
| Valencia Abraham | $290,000 | Placer Title Company | |
| Reid June | $95,000 | Fidelity National Title Co |
Source: Public Records
Mortgage History
| Date | Status | Borrower | Loan Amount |
|---|---|---|---|
| Previous Owner | Khorn Diana | $110,458 | |
| Previous Owner | Valencia Abraham | $232,000 | |
| Previous Owner | Reid June | $94,390 | |
| Closed | Reid June | $3,800 | |
| Closed | Valencia Abraham | $58,000 |
Source: Public Records
Tax History Compared to Growth
Tax History
| Year | Tax Paid | Tax Assessment Tax Assessment Total Assessment is a certain percentage of the fair market value that is determined by local assessors to be the total taxable value of land and additions on the property. | Land | Improvement |
|---|---|---|---|---|
| 2025 | $1,630 | $128,760 | $51,502 | $77,258 |
| 2024 | $1,630 | $126,237 | $50,493 | $75,744 |
| 2023 | $1,581 | $123,762 | $49,503 | $74,259 |
| 2022 | $1,566 | $121,336 | $48,533 | $72,803 |
| 2021 | $1,536 | $118,958 | $47,582 | $71,376 |
| 2020 | $1,509 | $117,740 | $47,095 | $70,645 |
| 2019 | $1,481 | $115,432 | $46,172 | $69,260 |
| 2018 | $1,441 | $113,169 | $45,267 | $67,902 |
| 2017 | $1,411 | $110,951 | $44,380 | $66,571 |
| 2016 | $1,268 | $108,776 | $43,510 | $65,266 |
| 2015 | $1,237 | $107,143 | $42,857 | $64,286 |
| 2014 | $1,225 | $105,045 | $42,018 | $63,027 |
Source: Public Records
Map
Nearby Homes
- 7895 Ann Arbor Way
- 7844 Deerglen Way
- 7843 Deer Creek Dr
- 240 Summer Stroll Cir
- 3950 Mack Rd Unit 66
- 3950 Mack Rd Unit 169
- 3950 Mack Rd Unit 129
- 3950 Mack Rd Unit 182
- 4515 Montril Way
- 7829 Acorri Walk
- 7835 Zaragoza Walk
- 7864 Monaldo Walk
- 7839 Brizio Walk
- 7759 Detroit Blvd
- 8110 Torrente Way
- 7718 Laurie Way
- 410 Sun Shower Cir
- 192 Creekside Cir
- 3765 Samos Way
- 7521 Sun Willow Ln
- 3997 Deer Cross Way
- 7955 Deer Water Dr
- 3989 Deer Cross Way
- 4001 Deer Cross Way
- 7951 Deer Water Dr
- 1 Pointer Ct
- 3992 Deer Cross Way
- 7948 Reindeer Way
- 3996 Deer Cross Way
- 3988 Deer Cross Way
- 4000 Deer Cross Way
- 3985 Deer Cross Way
- 7949 Deer Water Dr
- 7944 Reindeer Way
- 5 Pointer Ct
- 4016 Deer Cross Way
- 3984 Deer Cross Way
- 4017 De la Vina Way
- 4031 Deer Cross Way
- 3981 Deer Cross Way