3993 Wright Cir de Pere, WI 54115
Estimated Value: $361,652 - $462,000
Studio
--
Bath
--
Sq Ft
0.3
Acres
About This Home
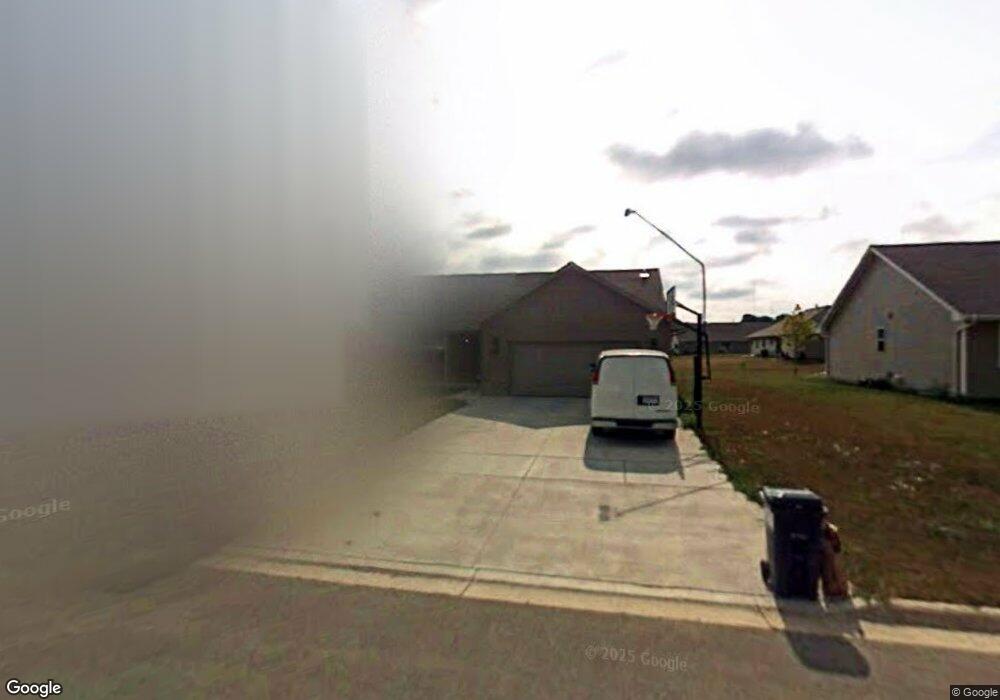
This home is located at 3993 Wright Cir, de Pere, WI 54115 and is currently estimated at $415,413. 3993 Wright Cir is a home located in Brown County with nearby schools including Heritage Elementary School, De Pere Middle School, and Foxview Intermediate School.
Ownership History
Date
Name
Owned For
Owner Type
Purchase Details
Closed on
Feb 17, 2010
Sold by
Ferry Stacey L and Malecki Stacey L
Bought by
Ferry Nickolas T and Ferry Stacey L
Current Estimated Value
Home Financials for this Owner
Home Financials are based on the most recent Mortgage that was taken out on this home.
Original Mortgage
$179,588
Outstanding Balance
$120,158
Interest Rate
5.25%
Mortgage Type
FHA
Estimated Equity
$295,255
Purchase Details
Closed on
Feb 7, 2007
Sold by
Lexington Homes Inc
Bought by
Ferry Nickolas T and Malecki Stacey L
Home Financials for this Owner
Home Financials are based on the most recent Mortgage that was taken out on this home.
Original Mortgage
$162,400
Interest Rate
9.6%
Mortgage Type
Purchase Money Mortgage
Purchase Details
Closed on
Aug 23, 2004
Sold by
Thomas J Juza Custom Home & Design Inc
Bought by
Lexington Homes Inc
Create a Home Valuation Report for This Property
The Home Valuation Report is an in-depth analysis detailing your home's value as well as a comparison with similar homes in the area
Home Values in the Area
Average Home Value in this Area
Purchase History
| Date | Buyer | Sale Price | Title Company |
|---|---|---|---|
| Ferry Nickolas T | -- | Title Trends | |
| Ferry Nickolas T | $162,400 | Evans Title | |
| Lexington Homes Inc | $1,540,000 | Bay Title & Abstract |
Source: Public Records
Mortgage History
| Date | Status | Borrower | Loan Amount |
|---|---|---|---|
| Open | Ferry Nickolas T | $179,588 | |
| Closed | Ferry Nickolas T | $162,400 |
Source: Public Records
Tax History
| Year | Tax Paid | Tax Assessment Tax Assessment Total Assessment is a certain percentage of the fair market value that is determined by local assessors to be the total taxable value of land and additions on the property. | Land | Improvement |
|---|---|---|---|---|
| 2024 | $4,366 | $296,300 | $61,100 | $235,200 |
| 2023 | $3,892 | $296,300 | $61,100 | $235,200 |
| 2022 | $4,773 | $296,300 | $61,100 | $235,200 |
| 2021 | $3,292 | $213,500 | $48,500 | $165,000 |
| 2020 | $3,400 | $213,500 | $48,500 | $165,000 |
| 2019 | $4,516 | $213,500 | $48,500 | $165,000 |
| 2018 | $3,733 | $213,500 | $48,500 | $165,000 |
| 2017 | $3,549 | $213,500 | $48,500 | $165,000 |
| 2016 | $3,185 | $162,500 | $38,700 | $123,800 |
| 2015 | $3,733 | $162,500 | $38,700 | $123,800 |
| 2014 | $4,000 | $162,500 | $38,700 | $123,800 |
| 2013 | $4,000 | $162,500 | $38,700 | $123,800 |
Source: Public Records
Map
Nearby Homes
- 3980 N Parker Way
- 3910 Monroe Rd
- 4011 Garrett St
- 2446 Reginald Hill
- 2524 Heritage Rd
- 2087 Swanstone Cir
- 1441 Ava Hope Ct
- 1679 Arnie's Ct
- 1655 Arnie's Ct
- 1941 Horseshoe Ln
- 658 Black Earth Dr
- 1482 Brayden Ln
- 1634 Trinity Ridge Cir
- 1769 Bobby Jones Dr
- 1756 Bobby Jones Dr
- 1780 Bobby Jones Dr
- 3924 Hawk Ledge Cir
- 1535 Brayden Ln
- 3808 Bower Creek Rd
- 1568 Brayden Ln
- 3989 Wright Cir
- 3997 Wright Cir
- 2369 Oak Ridge Cir
- 3967 Wright Cir
- 3975 Wright Cir
- 3992 Wright Cir
- 3945 Wright Cir
- 3996 Wright Cir
- 3949 Wright Cir
- 3988 Wright Cir
- 3941 Wright Cir
- 2360 Oak Ridge Cir
- 3955 Wright Cir
- 2356 Oak Ridge Cir
- 3984 Wright Cir
- 3980 Wright Cir
- 2352 Oak Ridge Cir
- 3972 Wright Cir
- 3997 N Parker Way
- 3976 Wright Cir