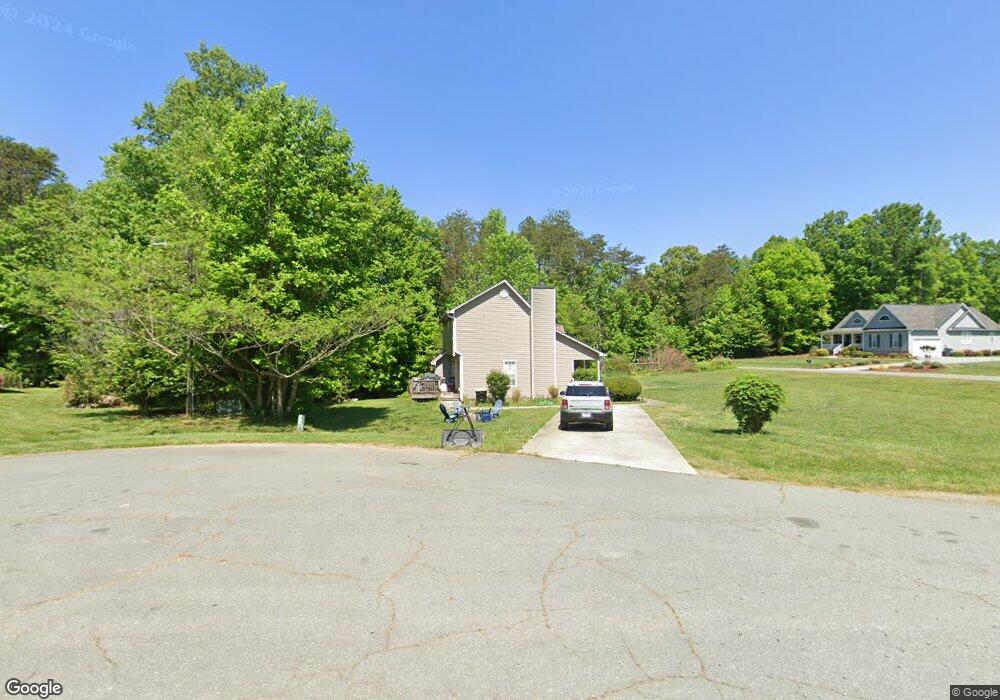
3993 Yount Ct Burlington, NC 27215
Estimated Value: $351,260 - $393,000
3
Beds
3
Baths
1,644
Sq Ft
$227/Sq Ft
Est. Value
About This Home
This home is located at 3993 Yount Ct, Burlington, NC 27215 and is currently estimated at $373,815, approximately $227 per square foot. 3993 Yount Ct is a home located in Alamance County with nearby schools including Edwin M. Holt Elementary School, Southern Alamance Middle School, and Southern Alamance High School.
Ownership History
Date
Name
Owned For
Owner Type
Purchase Details
Closed on
Sep 21, 2007
Sold by
Gaylyn Inc
Bought by
Long John J
Current Estimated Value
Home Financials for this Owner
Home Financials are based on the most recent Mortgage that was taken out on this home.
Original Mortgage
$154,500
Outstanding Balance
$97,719
Interest Rate
6.55%
Mortgage Type
New Conventional
Estimated Equity
$276,096
Purchase Details
Closed on
Jul 12, 2007
Sold by
Kellam
Bought by
Gaylyn Inc
Purchase Details
Closed on
Mar 1, 2006
Sold by
G W Wagoner Jr Builders I
Bought by
Rusca Vincente
Home Financials for this Owner
Home Financials are based on the most recent Mortgage that was taken out on this home.
Original Mortgage
$122,950
Interest Rate
6.04%
Mortgage Type
New Conventional
Create a Home Valuation Report for This Property
The Home Valuation Report is an in-depth analysis detailing your home's value as well as a comparison with similar homes in the area
Home Values in the Area
Average Home Value in this Area
Purchase History
| Date | Buyer | Sale Price | Title Company |
|---|---|---|---|
| Long John J | $155,000 | -- | |
| Gaylyn Inc | $115,000 | -- | |
| Rusca Vincente | $154,000 | -- |
Source: Public Records
Mortgage History
| Date | Status | Borrower | Loan Amount |
|---|---|---|---|
| Open | Long John J | $154,500 | |
| Previous Owner | Rusca Vincente | $122,950 | |
| Previous Owner | Rusca Vincente | $30,700 |
Source: Public Records
Tax History Compared to Growth
Tax History
| Year | Tax Paid | Tax Assessment Tax Assessment Total Assessment is a certain percentage of the fair market value that is determined by local assessors to be the total taxable value of land and additions on the property. | Land | Improvement |
|---|---|---|---|---|
| 2025 | $1,682 | $278,893 | $49,497 | $229,396 |
| 2024 | $1,529 | $278,893 | $49,497 | $229,396 |
| 2023 | $1,419 | $278,893 | $49,497 | $229,396 |
| 2022 | $1,209 | $158,258 | $32,985 | $125,273 |
| 2021 | $1,224 | $158,258 | $32,985 | $125,273 |
| 2020 | $1,240 | $158,258 | $32,985 | $125,273 |
| 2019 | $1,246 | $158,258 | $32,985 | $125,273 |
| 2018 | $0 | $158,258 | $32,985 | $125,273 |
| 2017 | $1,104 | $158,258 | $32,985 | $125,273 |
| 2016 | $1,188 | $172,796 | $32,985 | $139,811 |
| 2015 | $1,182 | $172,796 | $32,985 | $139,811 |
| 2014 | -- | $172,796 | $32,985 | $139,811 |
Source: Public Records
Map
Nearby Homes
- 3991 Bellemont Mount Hermon Rd
- 1629 Alyece Ct
- 3902 Chucks Ct
- 4105 Keepee Trail
- 3567 Bellemont Mount Hermon Rd
- 845 Grey Fox Trail
- 2524 Covington Loop
- 2619 Pepperstone Dr
- 1334 Bellemont Ln
- 4105 Ralph Holt Ct
- 4109 Ralph Holt Ct
- 1199 Cesar Ct
- 2392 Willowview Dr
- Asheville Plan at Council Creek
- Freeport Plan at Council Creek
- Ellerbe Plan at Council Creek
- Southport Plan at Council Creek
- Greensboro Plan at Council Creek
- Jamestown Plan at Council Creek
- Fairfield Plan at Council Creek