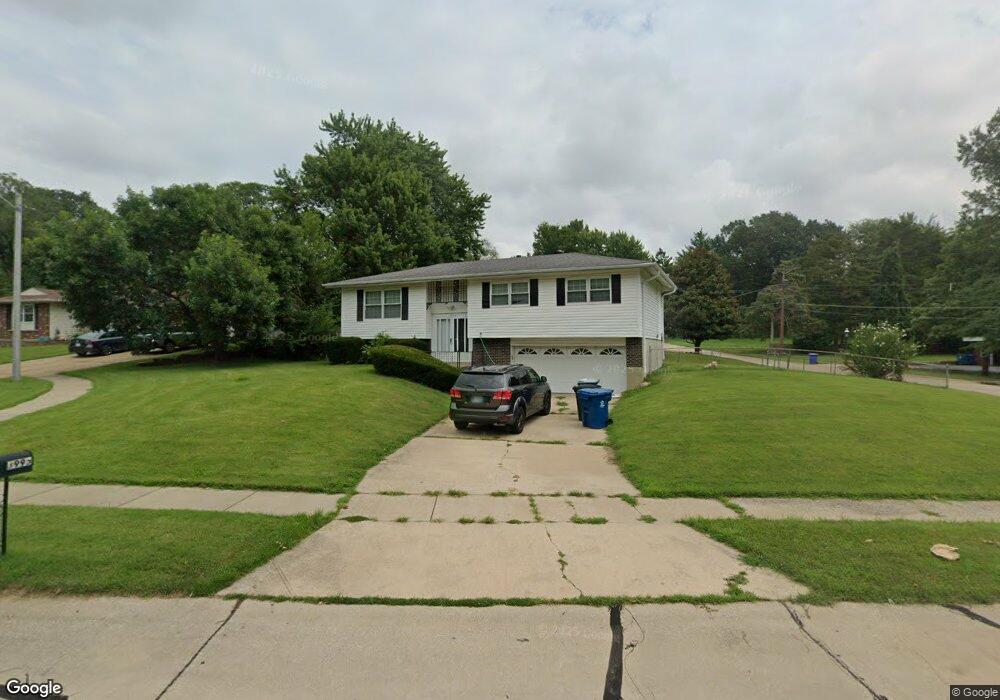
3995 Havercliff Ln Bridgeton, MO 63044
Estimated Value: $220,000 - $238,000
3
Beds
2
Baths
1,026
Sq Ft
$225/Sq Ft
Est. Value
About This Home
This home is located at 3995 Havercliff Ln, Bridgeton, MO 63044 and is currently estimated at $230,529, approximately $224 per square foot. 3995 Havercliff Ln is a home located in St. Louis County with nearby schools including Robert Drummond Elementary School, Holman Middle School, and Pattonville High School.
Ownership History
Date
Name
Owned For
Owner Type
Purchase Details
Closed on
May 30, 2017
Sold by
Rentz Larry R and Rentz Jeanne C
Bought by
Rentz Family Revocable Trust
Current Estimated Value
Purchase Details
Closed on
May 24, 2011
Sold by
Secretary Of Housing & Urban Development
Bought by
Monarch Park Properties Llc
Purchase Details
Closed on
Sep 21, 2010
Sold by
U S Bank N A
Bought by
Secretary Of Housing & Urban Development
Purchase Details
Closed on
Nov 6, 2009
Sold by
Tagsip Sophia G and Tagsip Jolito T
Bought by
U S Bank Na
Purchase Details
Closed on
Apr 5, 2004
Sold by
Belt Gary Leroy and Belt Joan I
Bought by
Tagsip Jolito T and Tagsip Sophia G
Home Financials for this Owner
Home Financials are based on the most recent Mortgage that was taken out on this home.
Original Mortgage
$141,382
Interest Rate
5.61%
Mortgage Type
FHA
Create a Home Valuation Report for This Property
The Home Valuation Report is an in-depth analysis detailing your home's value as well as a comparison with similar homes in the area
Home Values in the Area
Average Home Value in this Area
Purchase History
| Date | Buyer | Sale Price | Title Company |
|---|---|---|---|
| Rentz Family Revocable Trust | -- | None Available | |
| Monarch Park Properties Llc | $75,000 | None Available | |
| Secretary Of Housing & Urban Development | $1,303,072 | None Available | |
| U S Bank Na | $137,060 | None Available | |
| Tagsip Jolito T | $142,500 | -- |
Source: Public Records
Mortgage History
| Date | Status | Borrower | Loan Amount |
|---|---|---|---|
| Previous Owner | Tagsip Jolito T | $141,382 |
Source: Public Records
Tax History Compared to Growth
Tax History
| Year | Tax Paid | Tax Assessment Tax Assessment Total Assessment is a certain percentage of the fair market value that is determined by local assessors to be the total taxable value of land and additions on the property. | Land | Improvement |
|---|---|---|---|---|
| 2025 | $2,699 | $37,050 | $10,470 | $26,580 |
| 2024 | $2,699 | $33,200 | $8,840 | $24,360 |
| 2023 | $2,709 | $33,200 | $8,840 | $24,360 |
| 2022 | $2,343 | $25,880 | $5,700 | $20,180 |
| 2021 | $2,312 | $25,880 | $5,700 | $20,180 |
| 2020 | $2,368 | $25,730 | $4,430 | $21,300 |
| 2019 | $2,373 | $25,730 | $4,430 | $21,300 |
| 2018 | $2,417 | $24,180 | $3,170 | $21,010 |
| 2017 | $2,380 | $24,180 | $3,170 | $21,010 |
| 2016 | $2,324 | $23,200 | $2,530 | $20,670 |
| 2015 | $2,302 | $23,200 | $2,530 | $20,670 |
| 2014 | $2,234 | $22,400 | $1,690 | $20,710 |
Source: Public Records
Map
Nearby Homes
- 3960 Havercliff Ln
- 4040 Locke Ave
- 4115 Scotch Dr
- 3946 Lockport Dr
- 4151 Scotch Dr
- 11742 Parish Dr
- 4151 Lockport Dr
- 4141 Gallatin Ln Unit C
- 11680 Mark Twain Ln
- 4159 Gallatin Ln Unit B
- 3754 Red Hawk Ct
- 11533 Old Saint Charles Rd
- 4140 Fee Rd
- 3823 Midview Ave
- 3317 Bridgeton Trails Dr
- 11525 Ivy Green Dr
- 3063 Autumn Shores Dr Unit 491
- 3124 Autumn Shores Dr Unit 434
- 3110 Autumn Shores Dr Unit 445
- 4105 Banks Rd
- 4007 Locke Ave
- 3991 Havercliff Ln
- 3980 Havercliff Ln
- 4002 Locke Ave
- 3987 Havercliff Ln
- 3981 Havercliff Ln
- 3984 Locke Ave
- 4011 Locke Ave
- 3977 Havercliff Ln
- 3968 Havercliff Ln
- 3969 Havercliff Ln
- 3980 Locke Ave
- 4031 Locke Ave
- 3963 Havercliff Ln
- 4024 Locke Ave
- 3954 Havercliff Ln
- 3957 Havercliff Ln
- 4034 Locke Ave
- 4051 Locke Ave
- 3949 Havercliff Ln