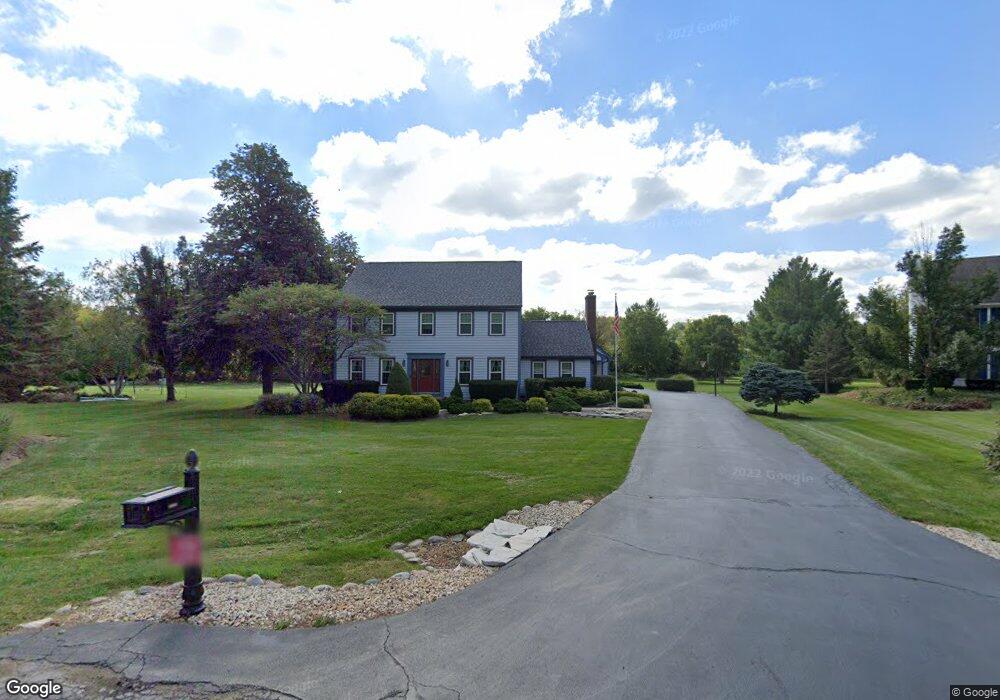
39W009 Cloverfield Cir Unit 6 Saint Charles, IL 60175
Cranston Meadows Park NeighborhoodEstimated Value: $552,267 - $669,000
--
Bed
1
Bath
2,826
Sq Ft
$217/Sq Ft
Est. Value
About This Home
This home is located at 39W009 Cloverfield Cir Unit 6, Saint Charles, IL 60175 and is currently estimated at $613,317, approximately $217 per square foot. 39W009 Cloverfield Cir Unit 6 is a home located in Kane County with nearby schools including Ferson Creek Elementary School, Thompson Middle School, and St Charles North High School.
Ownership History
Date
Name
Owned For
Owner Type
Purchase Details
Closed on
Nov 13, 2023
Sold by
Stetina Joseph L and Stetina Carole S
Bought by
Joseph L Stetina Trust and Stetina
Current Estimated Value
Purchase Details
Closed on
Jul 18, 2000
Sold by
Long Jerry W and Long Kathy N
Bought by
Stetina Joseph L and Stetina Carole S
Home Financials for this Owner
Home Financials are based on the most recent Mortgage that was taken out on this home.
Original Mortgage
$280,000
Interest Rate
7.37%
Purchase Details
Closed on
Apr 14, 1997
Sold by
Coban William A and Coban Patricia L
Bought by
Long Jerry W and Long Kathy N
Home Financials for this Owner
Home Financials are based on the most recent Mortgage that was taken out on this home.
Original Mortgage
$175,000
Interest Rate
7.93%
Create a Home Valuation Report for This Property
The Home Valuation Report is an in-depth analysis detailing your home's value as well as a comparison with similar homes in the area
Home Values in the Area
Average Home Value in this Area
Purchase History
| Date | Buyer | Sale Price | Title Company |
|---|---|---|---|
| Joseph L Stetina Trust | -- | None Listed On Document | |
| Stetina Joseph L | -- | First American Title Ins Co | |
| Long Jerry W | $302,500 | Chicago Title Insurance Co |
Source: Public Records
Mortgage History
| Date | Status | Borrower | Loan Amount |
|---|---|---|---|
| Previous Owner | Stetina Joseph L | $280,000 | |
| Previous Owner | Long Jerry W | $175,000 |
Source: Public Records
Tax History Compared to Growth
Tax History
| Year | Tax Paid | Tax Assessment Tax Assessment Total Assessment is a certain percentage of the fair market value that is determined by local assessors to be the total taxable value of land and additions on the property. | Land | Improvement |
|---|---|---|---|---|
| 2024 | $9,457 | $151,027 | $5,371 | $145,656 |
| 2023 | $9,801 | $135,026 | $4,802 | $130,224 |
| 2022 | $9,316 | $123,030 | $4,375 | $118,655 |
| 2021 | $8,914 | $116,165 | $4,131 | $112,034 |
| 2020 | $8,914 | $114,494 | $4,072 | $110,422 |
| 2019 | $8,817 | $112,813 | $4,012 | $108,801 |
| 2018 | $8,820 | $112,813 | $4,012 | $108,801 |
| 2017 | $7,760 | $111,157 | $3,953 | $107,204 |
| 2016 | $8,272 | $108,351 | $3,853 | $104,498 |
| 2015 | -- | $105,359 | $3,747 | $101,612 |
| 2014 | -- | $106,974 | $3,804 | $103,170 |
| 2013 | -- | $108,769 | $3,868 | $104,901 |
Source: Public Records
Map
Nearby Homes
- 7N610 Cloverfield Cir
- 38W725 Cloverfield Dr
- 3591 Sandstone Cir
- 3588 Sandstone Cir
- 3590 Sandstone Cir
- 7N919 Cloverfield Rd
- 1857 Chandolin Ln
- 1865 Chandolin Ln
- 1863 Chandolin Ln
- 1867 Chandolin Ln
- 1851 Diamond Dr
- 1847 Diamond Dr
- 1858 Chandolin Ln
- 1854 Chandolin Ln
- 1848 Chandolin Ln
- 1846 Chandolin Ln
- 1850 Chandolin Ln
- 6N729 Old Homestead Rd
- 3620 Sahara Rd
- 761 Reserve Ct
- 39W029 Cloverfield Cir Unit 6
- 38W815 Cloverfield Cir
- 7N551 Cloverfield Cir
- 39W045 Cloverfield Cir
- 38W783 Cloverfield Cir
- 38W800 Cloverfield Cir
- 7N571 Cloverfield Cir
- 7N544 Cloverfield Cir
- 38W755 Cloverfield Cir
- 38W756 Northern Ct Unit 4
- 38W778 Cloverfield Cir
- 38W770 Northern Ct
- 7N576 Cloverfield Cir Unit 1
- 7N591 Cloverfield Cir
- 38W736 Cloverfield Cir
- 39W030 Ridge Line Rd
- 39W086 Ridge Line Rd
- 39W054 Ridge Line Rd Unit 5
- 38W769 Northern Ct
- 39W110 Ridge Line Rd