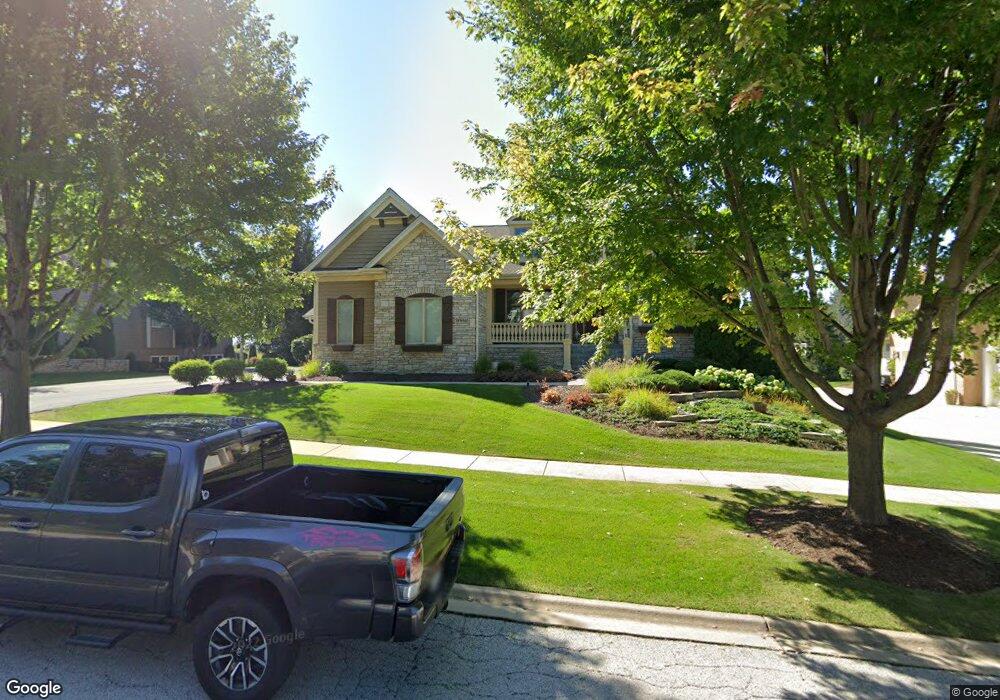
39W645 S Mathewson Ln Geneva, IL 60134
Mill Creek NeighborhoodEstimated Value: $653,000 - $839,507
5
Beds
4
Baths
4,437
Sq Ft
$170/Sq Ft
Est. Value
About This Home
This home is located at 39W645 S Mathewson Ln, Geneva, IL 60134 and is currently estimated at $753,377, approximately $169 per square foot. 39W645 S Mathewson Ln is a home located in Kane County with nearby schools including Fabyan Elementary School, Geneva Community High School, and St. Peter School.
Ownership History
Date
Name
Owned For
Owner Type
Purchase Details
Closed on
May 8, 2017
Sold by
Edling Cheryl L
Bought by
Zukowski Robert and Zukowski Nancy
Current Estimated Value
Home Financials for this Owner
Home Financials are based on the most recent Mortgage that was taken out on this home.
Original Mortgage
$454,500
Outstanding Balance
$372,891
Interest Rate
3.62%
Mortgage Type
Adjustable Rate Mortgage/ARM
Estimated Equity
$380,486
Purchase Details
Closed on
Jul 20, 2004
Sold by
Edling John L and Edling Cheryl L
Bought by
Edling Cheryl L and The Cheryl L Edling Declaration Of Trust
Purchase Details
Closed on
Jun 27, 2001
Sold by
Dupage National Bank
Bought by
Edling John L and Edling Cheryl L
Home Financials for this Owner
Home Financials are based on the most recent Mortgage that was taken out on this home.
Original Mortgage
$185,000
Interest Rate
7.18%
Create a Home Valuation Report for This Property
The Home Valuation Report is an in-depth analysis detailing your home's value as well as a comparison with similar homes in the area
Home Values in the Area
Average Home Value in this Area
Purchase History
| Date | Buyer | Sale Price | Title Company |
|---|---|---|---|
| Zukowski Robert | $505,000 | Alliance Title Corp | |
| Edling Cheryl L | -- | -- | |
| Edling John L | $530,000 | Chicago Title Insurance Co |
Source: Public Records
Mortgage History
| Date | Status | Borrower | Loan Amount |
|---|---|---|---|
| Open | Zukowski Robert | $454,500 | |
| Previous Owner | Edling John L | $185,000 |
Source: Public Records
Tax History Compared to Growth
Tax History
| Year | Tax Paid | Tax Assessment Tax Assessment Total Assessment is a certain percentage of the fair market value that is determined by local assessors to be the total taxable value of land and additions on the property. | Land | Improvement |
|---|---|---|---|---|
| 2024 | $17,437 | $217,893 | $42,002 | $175,891 |
| 2023 | $16,854 | $196,654 | $37,908 | $158,746 |
| 2022 | $15,837 | $179,941 | $34,791 | $145,150 |
| 2021 | $15,317 | $172,225 | $33,299 | $138,926 |
| 2020 | $14,888 | $168,189 | $32,519 | $135,670 |
| 2019 | $14,717 | $164,426 | $32,042 | $132,384 |
| 2018 | $15,758 | $176,045 | $32,042 | $144,003 |
| 2017 | $15,748 | $174,044 | $31,678 | $142,366 |
| 2016 | $16,270 | $178,261 | $30,842 | $147,419 |
| 2015 | -- | $150,792 | $29,639 | $121,153 |
| 2014 | -- | $150,247 | $32,979 | $117,268 |
| 2013 | -- | $150,247 | $32,979 | $117,268 |
Source: Public Records
Map
Nearby Homes
- 39W841 S Hathaway Ln
- 0S170 Bealer Cir
- Abigail Ranch Plan at Mill Creek North - Mill Creek
- The Northstar Ranch Plan at Mill Creek North - Mill Creek
- Carrington Plan at Mill Creek North - Mill Creek
- Chickory Plan at Mill Creek North - Mill Creek
- Blue Stem Plan at Mill Creek North - Mill Creek
- Lot 2 Fabyan Pkwy
- Lot 1 Fabyan Pkwy
- 0 Fabyan Pkwy Unit MRD12461823
- 39W796 N Hathaway Ln
- 39W915 Catlin Square
- 39W275 Fabyan Pkwy
- 39W507 Newton Square
- 39W380 Armstrong Ln
- 39W644 Harvey Square
- 0N404 N Mill Creek Dr
- 0N285 King Dr
- 39W421 W Mallory Dr
- N289 Hilts Dr
- 39W625 S Mathewson Ln
- 39W665 S Mathewson Ln
- 39W640 S Mathewson Ln
- 39W605 S Mathewson Ln
- 39W610 S Mathewson Ln
- 39W660 S Mathewson Ln
- 39W585 S Mathewson Ln
- 39W590 S Mathewson Ln
- 39W621 Bealer Cir
- 39W597 Bealer Cir
- 39W597 Bealer (J55) Cir
- 39W641 Bealer Cir
- 39W570 S Mathewson Ln
- 39W570 S Mathewson (J35) Ln
- 39W581 Bealer Cir
- 39W565 S Mathewson Ln
- 0S351 S Mathewson Ln
- 39W561 Bealer Cir
- 39W561 Bealer (J53) Cir
- 39W550 S Mathewson Ln