Estimated Value: $1,933,447 - $2,146,000
4
Beds
4
Baths
5,151
Sq Ft
$405/Sq Ft
Est. Value
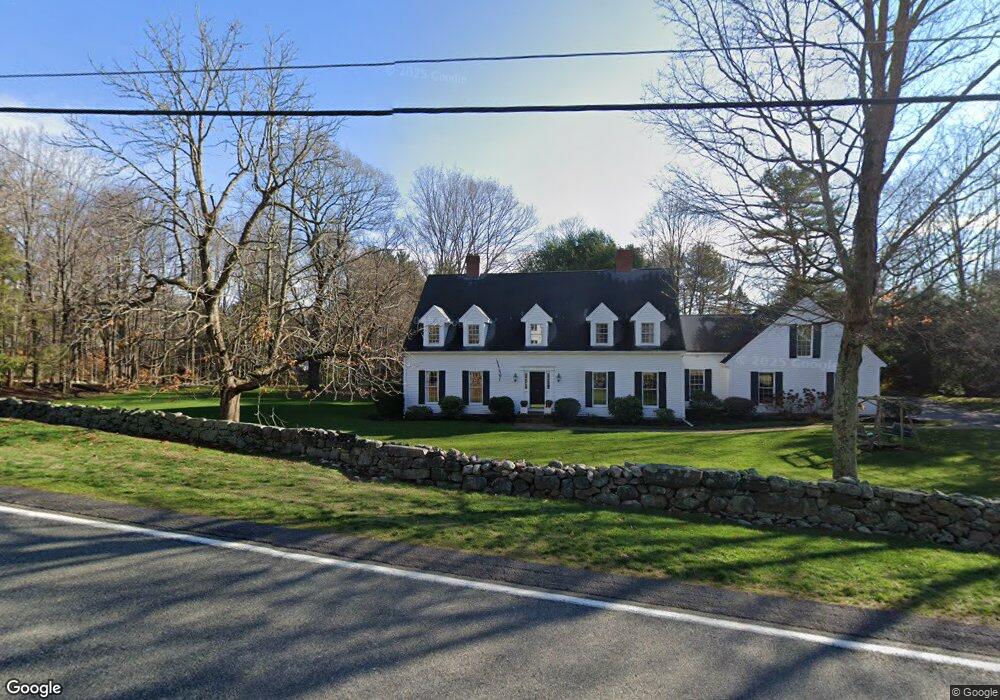
About This Home
This home is located at 3A Main St, Dover, MA 02030 and is currently estimated at $2,083,612, approximately $404 per square foot. 3A Main St is a home located in Norfolk County with nearby schools including Chickering Elementary School, Dover-Sherborn Regional Middle School, and Dover-Sherborn Regional High School.
Ownership History
Date
Name
Owned For
Owner Type
Purchase Details
Closed on
Jul 15, 2016
Sold by
Carter Jeffrey S and Carter Anne J
Bought by
Birmingham Stephen D and Birmingham Alison A
Current Estimated Value
Home Financials for this Owner
Home Financials are based on the most recent Mortgage that was taken out on this home.
Original Mortgage
$713,000
Outstanding Balance
$570,653
Interest Rate
3.66%
Mortgage Type
Unknown
Estimated Equity
$1,512,959
Purchase Details
Closed on
Apr 2, 1987
Sold by
Springdale Farms Lp
Bought by
Carter Jeffrey S
Create a Home Valuation Report for This Property
The Home Valuation Report is an in-depth analysis detailing your home's value as well as a comparison with similar homes in the area
Home Values in the Area
Average Home Value in this Area
Purchase History
| Date | Buyer | Sale Price | Title Company |
|---|---|---|---|
| Birmingham Stephen D | $1,190,000 | -- | |
| Carter Jeffrey S | $516,911 | -- |
Source: Public Records
Mortgage History
| Date | Status | Borrower | Loan Amount |
|---|---|---|---|
| Open | Birmingham Stephen D | $713,000 | |
| Previous Owner | Carter Jeffrey S | $200,000 | |
| Previous Owner | Carter Jeffrey S | $140,000 | |
| Previous Owner | Carter Jeffrey S | $100,000 | |
| Previous Owner | Carter Jeffrey S | $185,000 |
Source: Public Records
Tax History
| Year | Tax Paid | Tax Assessment Tax Assessment Total Assessment is a certain percentage of the fair market value that is determined by local assessors to be the total taxable value of land and additions on the property. | Land | Improvement |
|---|---|---|---|---|
| 2025 | $18,887 | $1,675,900 | $664,900 | $1,011,000 |
| 2024 | $17,615 | $1,607,200 | $664,900 | $942,300 |
| 2023 | $16,435 | $1,348,200 | $523,200 | $825,000 |
| 2022 | $15,530 | $1,250,400 | $523,200 | $727,200 |
| 2021 | $15,781 | $1,224,300 | $523,200 | $701,100 |
| 2020 | $15,720 | $1,224,300 | $523,200 | $701,100 |
| 2019 | $15,830 | $1,224,300 | $523,200 | $701,100 |
| 2018 | $14,020 | $1,091,900 | $427,400 | $664,500 |
| 2017 | $12,754 | $977,300 | $414,300 | $563,000 |
| 2016 | $11,439 | $888,100 | $414,300 | $473,800 |
| 2015 | $11,279 | $888,100 | $414,300 | $473,800 |
Source: Public Records
Map
Nearby Homes
Your Personal Tour Guide
Ask me questions while you tour the home.