Estimated Value: $258,000 - $326,000
3
Beds
3
Baths
2,448
Sq Ft
$121/Sq Ft
Est. Value
About This Home
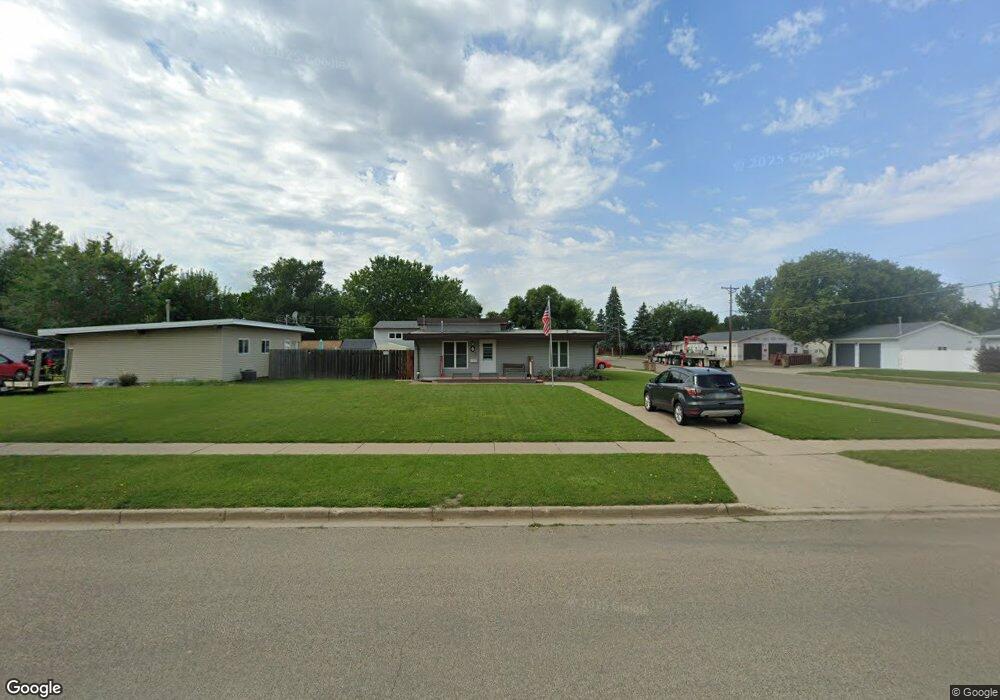
This home is located at 4 18th St SW, Minot, ND 58701 and is currently estimated at $295,803, approximately $120 per square foot. 4 18th St SW is a home located in Ward County with nearby schools including Perkett Elementary School, Jim Hill Middle School, and Magic City Campus High School.
Ownership History
Date
Name
Owned For
Owner Type
Purchase Details
Closed on
Dec 1, 2021
Sold by
Strandlien Cody and Estate Of David Strandlien
Bought by
Samuelson Scott A and Samuelson Connie S
Current Estimated Value
Home Financials for this Owner
Home Financials are based on the most recent Mortgage that was taken out on this home.
Original Mortgage
$227,490
Outstanding Balance
$209,175
Interest Rate
3.09%
Mortgage Type
VA
Estimated Equity
$86,628
Purchase Details
Closed on
Feb 14, 2006
Sold by
Sieben Ronald P and Sieben Julie A
Bought by
Bitterolf Scott A and Bitterolf Trerrie L
Home Financials for this Owner
Home Financials are based on the most recent Mortgage that was taken out on this home.
Original Mortgage
$135,348
Interest Rate
6.3%
Mortgage Type
VA
Create a Home Valuation Report for This Property
The Home Valuation Report is an in-depth analysis detailing your home's value as well as a comparison with similar homes in the area
Home Values in the Area
Average Home Value in this Area
Purchase History
| Date | Buyer | Sale Price | Title Company |
|---|---|---|---|
| Samuelson Scott A | $121,000 | None Available | |
| Bitterolf Scott A | -- | None Available |
Source: Public Records
Mortgage History
| Date | Status | Borrower | Loan Amount |
|---|---|---|---|
| Open | Samuelson Scott A | $227,490 | |
| Previous Owner | Bitterolf Scott A | $135,348 |
Source: Public Records
Tax History
| Year | Tax Paid | Tax Assessment Tax Assessment Total Assessment is a certain percentage of the fair market value that is determined by local assessors to be the total taxable value of land and additions on the property. | Land | Improvement |
|---|---|---|---|---|
| 2024 | $192 | $135,000 | $21,500 | $113,500 |
| 2023 | $0 | $135,500 | $21,500 | $114,000 |
| 2022 | $1,130 | $126,000 | $20,000 | $106,000 |
| 2021 | $543 | $108,000 | $20,000 | $88,000 |
| 2020 | $897 | $105,000 | $20,000 | $85,000 |
| 2019 | $1,596 | $105,000 | $20,000 | $85,000 |
| 2018 | $1,564 | $104,500 | $20,000 | $84,500 |
| 2017 | $1,471 | $105,500 | $22,500 | $83,000 |
| 2016 | $1,154 | $104,000 | $22,500 | $81,500 |
| 2015 | $2,326 | $104,000 | $0 | $0 |
| 2014 | $2,326 | $94,500 | $0 | $0 |
Source: Public Records
Map
Nearby Homes
- 5 19th St NW
- 200 18th St NW
- 221 17th St NW
- 15 22nd St SW
- 420 16th St NW
- 108 24th St SW
- 514 16th St SW
- 516 19th St NW
- 418 23rd St SW
- 424 23rd St NW
- 200 11th St SW
- 516 22nd St NW
- 616 18th St NW
- 117 26th St SW
- 623 12th St NW
- 1714 University Ave W
- 145 26th St SW
- 609 11th St NW
- 2304 8th Ave NW
- 913 20th St NW
- 10 18th St SW
- 1800 W Central Ave
- 1805 W Central Ave
- 1715 W Central Ave
- 14 18th St SW
- 11 18th St SW
- 5 18th St NW
- 18 18th St SW
- 1720 W Central Ave
- 15 18th St SW
- 1815 W Central Ave
- 9 18th St NW
- 1804 1st Ave SW
- 1718 W Central Ave
- 6 19th St NW
- 1814 1st Ave SW
- 15 18th St NW
- 1714 W Central Ave
- 1825 W Central Ave
- 1708 1st Ave SW
Your Personal Tour Guide
Ask me questions while you tour the home.