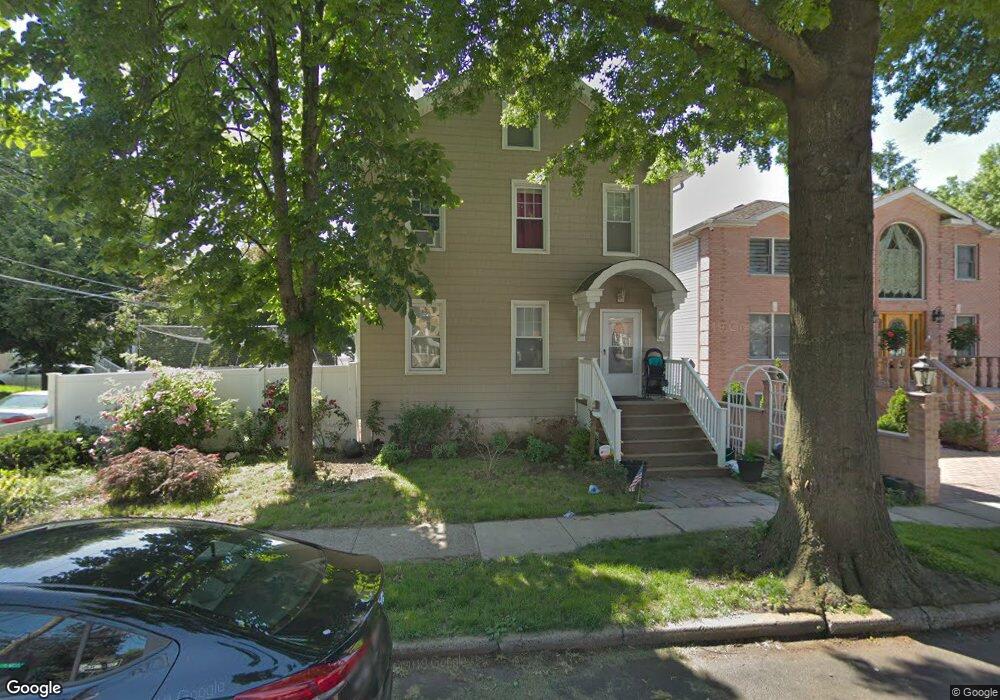
4 3rd St Staten Island, NY 10306
New Dorp NeighborhoodEstimated Value: $847,000 - $871,000
--
Bed
4
Baths
1,752
Sq Ft
$493/Sq Ft
Est. Value
About This Home
This home is located at 4 3rd St, Staten Island, NY 10306 and is currently estimated at $863,381, approximately $492 per square foot. 4 3rd St is a home located in Richmond County with nearby schools including P.S. 41 The Stephanie a Vierno School, Is 2 George L Egbert, and New Dorp High School.
Ownership History
Date
Name
Owned For
Owner Type
Purchase Details
Closed on
Mar 17, 2011
Sold by
Cullen Anna
Bought by
Cullen Frank
Current Estimated Value
Purchase Details
Closed on
Feb 11, 2004
Sold by
Sherwood Julia C and Estate Of Julia C Haley
Bought by
Block 2898 Building Corp
Home Financials for this Owner
Home Financials are based on the most recent Mortgage that was taken out on this home.
Original Mortgage
$39,000
Interest Rate
6.01%
Mortgage Type
Credit Line Revolving
Purchase Details
Closed on
Dec 29, 2003
Sold by
Sherwood Julia C and The Estate Of Julia C Haley
Bought by
Cullen Frank and Cullen Anna
Home Financials for this Owner
Home Financials are based on the most recent Mortgage that was taken out on this home.
Original Mortgage
$39,000
Interest Rate
6.01%
Mortgage Type
Credit Line Revolving
Create a Home Valuation Report for This Property
The Home Valuation Report is an in-depth analysis detailing your home's value as well as a comparison with similar homes in the area
Home Values in the Area
Average Home Value in this Area
Purchase History
| Date | Buyer | Sale Price | Title Company |
|---|---|---|---|
| Cullen Frank | -- | None Available | |
| Block 2898 Building Corp | $340,000 | -- | |
| Cullen Frank | $390,000 | United General Title Ins Co |
Source: Public Records
Mortgage History
| Date | Status | Borrower | Loan Amount |
|---|---|---|---|
| Previous Owner | Cullen Frank | $39,000 | |
| Previous Owner | Cullen Frank | $312,000 |
Source: Public Records
Tax History Compared to Growth
Tax History
| Year | Tax Paid | Tax Assessment Tax Assessment Total Assessment is a certain percentage of the fair market value that is determined by local assessors to be the total taxable value of land and additions on the property. | Land | Improvement |
|---|---|---|---|---|
| 2025 | $7,983 | $54,240 | $9,125 | $45,115 |
| 2024 | $7,983 | $47,880 | $10,160 | $37,720 |
| 2023 | $7,686 | $37,843 | $8,239 | $29,604 |
| 2022 | $5,224 | $45,720 | $12,240 | $33,480 |
| 2021 | $7,517 | $41,280 | $12,240 | $29,040 |
| 2020 | $4,806 | $38,400 | $12,240 | $26,160 |
| 2019 | $4,602 | $39,300 | $12,240 | $27,060 |
| 2018 | $6,429 | $31,536 | $11,529 | $20,007 |
| 2017 | $6,425 | $31,518 | $12,154 | $19,364 |
| 2016 | $5,950 | $29,764 | $11,882 | $17,882 |
| 2015 | $5,297 | $28,080 | $10,200 | $17,880 |
| 2014 | $5,297 | $27,600 | $10,200 | $17,400 |
Source: Public Records
Map
Nearby Homes