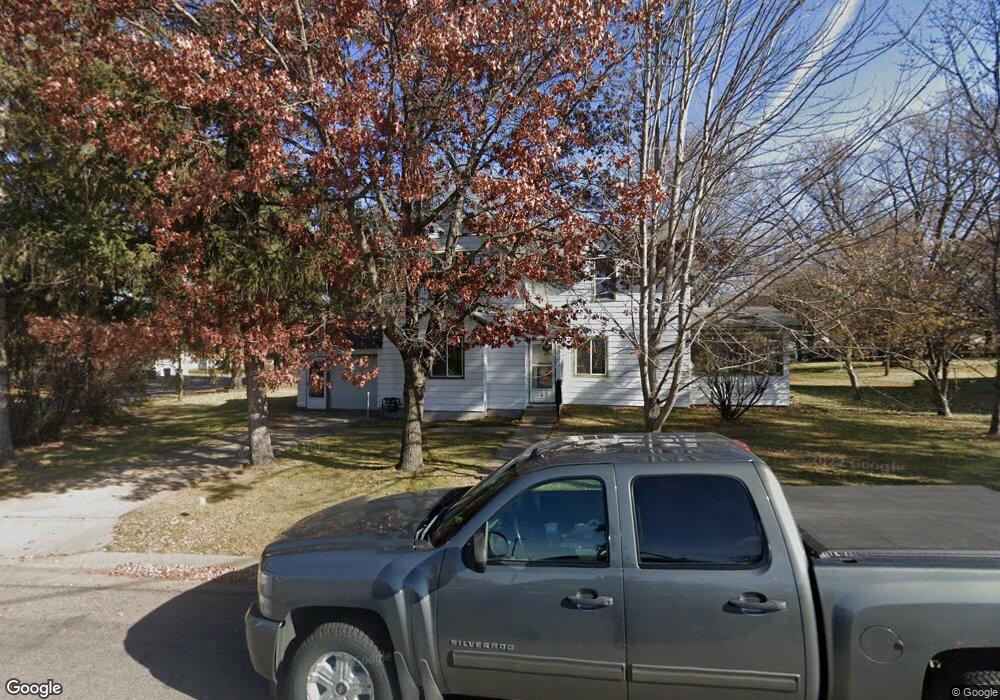
4 5th Ave S Sauk Rapids, MN 56379
Estimated Value: $223,736 - $261,000
4
Beds
3
Baths
3,176
Sq Ft
$75/Sq Ft
Est. Value
About This Home
This home is located at 4 5th Ave S, Sauk Rapids, MN 56379 and is currently estimated at $237,934, approximately $74 per square foot. 4 5th Ave S is a home located in Benton County with nearby schools including Mississippi Heights Elementary School, Sauk Rapids-Rice Middle School, and Sauk Rapids-Rice Senior High School.
Ownership History
Date
Name
Owned For
Owner Type
Purchase Details
Closed on
Nov 4, 2020
Sold by
Jude Jeremy M
Bought by
Barhorst Ryan A
Current Estimated Value
Home Financials for this Owner
Home Financials are based on the most recent Mortgage that was taken out on this home.
Original Mortgage
$138,550
Outstanding Balance
$123,290
Interest Rate
2.8%
Mortgage Type
New Conventional
Estimated Equity
$114,644
Purchase Details
Closed on
Sep 30, 2010
Sold by
Federal National Mortgage Association
Bought by
Entrust Midwest Llc
Create a Home Valuation Report for This Property
The Home Valuation Report is an in-depth analysis detailing your home's value as well as a comparison with similar homes in the area
Home Values in the Area
Average Home Value in this Area
Purchase History
| Date | Buyer | Sale Price | Title Company |
|---|---|---|---|
| Barhorst Ryan A | $163,000 | First American Title Ins Co | |
| Entrust Midwest Llc | -- | -- | |
| Barhorst Ryan Ryan | $163,000 | -- |
Source: Public Records
Mortgage History
| Date | Status | Borrower | Loan Amount |
|---|---|---|---|
| Open | Barhorst Ryan A | $138,550 | |
| Closed | Barhorst Ryan Ryan | $161,000 |
Source: Public Records
Tax History Compared to Growth
Tax History
| Year | Tax Paid | Tax Assessment Tax Assessment Total Assessment is a certain percentage of the fair market value that is determined by local assessors to be the total taxable value of land and additions on the property. | Land | Improvement |
|---|---|---|---|---|
| 2025 | $4,160 | $189,200 | $28,500 | $160,700 |
| 2024 | $4,288 | $181,500 | $28,500 | $153,000 |
| 2023 | $1,904 | $181,400 | $28,500 | $152,900 |
| 2022 | $1,662 | $161,600 | $25,900 | $135,700 |
| 2021 | $1,526 | $134,100 | $25,900 | $108,200 |
| 2020 | $1,508 | $125,700 | $24,900 | $100,800 |
| 2018 | $1,336 | $88,300 | $19,086 | $69,214 |
| 2017 | $1,336 | $82,000 | $18,664 | $63,336 |
| 2016 | $1,322 | $104,800 | $24,900 | $79,900 |
| 2015 | $1,318 | $70,900 | $17,796 | $53,104 |
| 2014 | -- | $66,200 | $17,370 | $48,830 |
| 2013 | -- | $68,300 | $17,569 | $50,731 |
Source: Public Records
Map
Nearby Homes
- 117 6th Ave N
- 112 Summit Ave S
- 216 8th Ave N
- 100 9th Ave S
- 615 3rd Ave N
- 608 Summit Ave S
- 1804 8th Ave S
- 1803 8th Ave S
- 224 9th St N
- 1101 10th Ave N
- 1107 10th Ave N
- 2021 Hillcrest Dr
- 1105 Summit Ave N
- 1021 5th St S
- 1 Skyview Dr
- 3300 321st St
- 3322 321st St
- 1201 10th Ave N
- 752 12th St N
- 2161 Mill Pond Dr