Estimated Value: $1,447,137 - $1,834,000
4
Beds
3
Baths
3,719
Sq Ft
$453/Sq Ft
Est. Value
About This Home
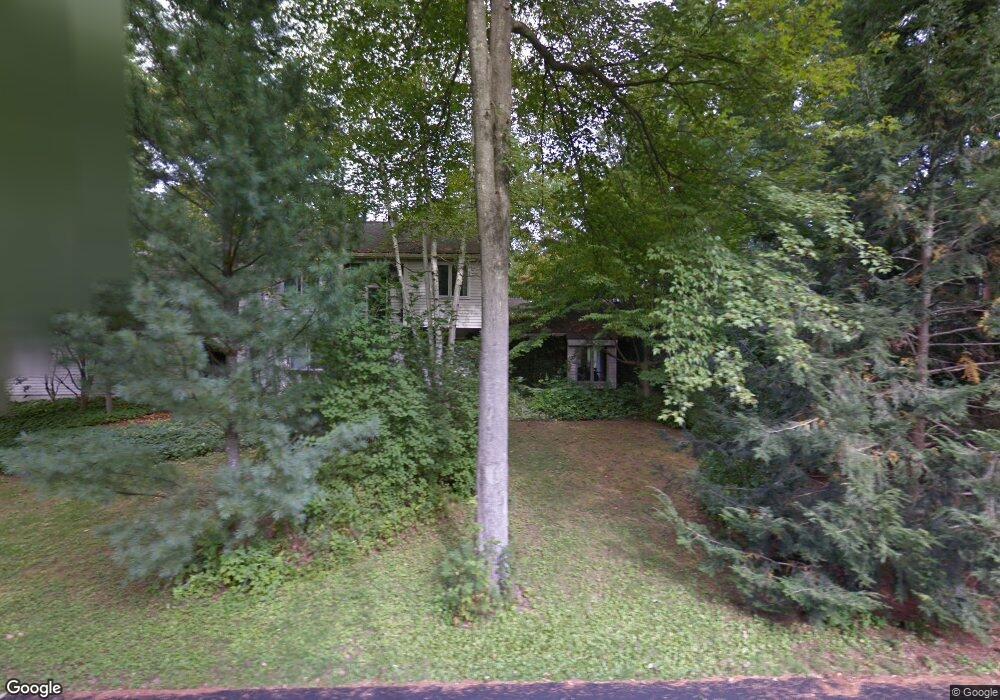
This home is located at 4 Abbe Rd, Dover, MA 02030 and is currently estimated at $1,685,284, approximately $453 per square foot. 4 Abbe Rd is a home located in Norfolk County with nearby schools including Chickering Elementary School, Dover-Sherborn Regional Middle School, and Dover-Sherborn Regional High School.
Ownership History
Date
Name
Owned For
Owner Type
Purchase Details
Closed on
Dec 30, 2010
Sold by
Adduci Maureen T and Mittelman Drew M
Bought by
4 Abbe Road Rt
Current Estimated Value
Purchase Details
Closed on
Jan 10, 1978
Bought by
4 Abbe Rd Rt
Create a Home Valuation Report for This Property
The Home Valuation Report is an in-depth analysis detailing your home's value as well as a comparison with similar homes in the area
Home Values in the Area
Average Home Value in this Area
Purchase History
| Date | Buyer | Sale Price | Title Company |
|---|---|---|---|
| 4 Abbe Road Rt | -- | -- | |
| 4 Abbe Rd Rt | $65,000 | -- |
Source: Public Records
Tax History
| Year | Tax Paid | Tax Assessment Tax Assessment Total Assessment is a certain percentage of the fair market value that is determined by local assessors to be the total taxable value of land and additions on the property. | Land | Improvement |
|---|---|---|---|---|
| 2025 | $15,011 | $1,331,900 | $563,800 | $768,100 |
| 2024 | $13,834 | $1,262,200 | $544,700 | $717,500 |
| 2023 | $13,443 | $1,102,800 | $477,800 | $625,000 |
| 2022 | $12,495 | $1,006,000 | $458,700 | $547,300 |
| 2021 | $13,186 | $1,023,000 | $458,700 | $564,300 |
| 2020 | $13,135 | $1,023,000 | $458,700 | $564,300 |
| 2019 | $13,227 | $1,023,000 | $458,700 | $564,300 |
| 2018 | $12,733 | $991,700 | $458,700 | $533,000 |
| 2017 | $12,662 | $970,300 | $420,500 | $549,800 |
| 2016 | $12,497 | $970,300 | $420,500 | $549,800 |
| 2015 | $12,055 | $949,200 | $399,400 | $549,800 |
Source: Public Records
Map
Nearby Homes
- 54 Abbe Rd Unit 54
- 70 Abbe Rd Unit 70
- 48 Abbe Rd
- 42 Abbe Rd
- 44 Abbe Rd Unit 44
- 38 Abbe Rd
- 14 Bretton Rd
- 23 Bretton Rd
- 31 Abbe Rd Unit 31
- 73 Abbe Rd Unit 73
- 69 Abbe Rd Unit 69
- 79 Abbe Rd
- 43 Abbe Rd Unit 43
- 39 Abbe Rd Unit 39
- 19 Bretton Rd
- 19 Bretton Rd
- 7 Abbe Rd
- 9 Normandie Rd
- 3 Abbe Rd
- 27 Bretton Rd
Your Personal Tour Guide
Ask me questions while you tour the home.