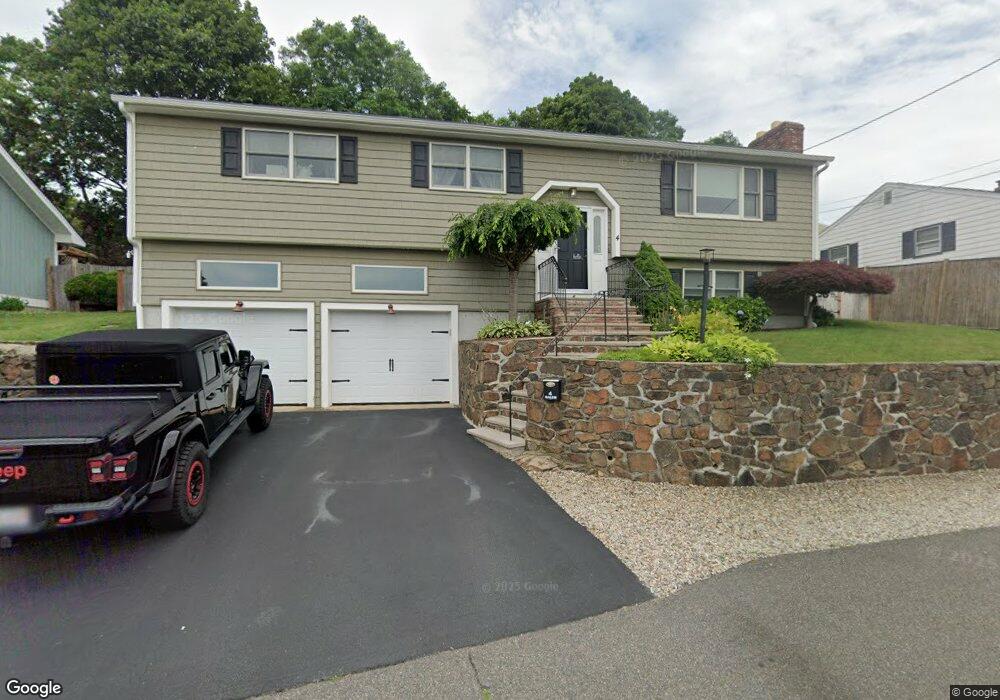
4 Aberdeen St Salem, MA 01970
Witchcraft Heights NeighborhoodEstimated Value: $667,507 - $750,000
3
Beds
3
Baths
2,079
Sq Ft
$343/Sq Ft
Est. Value
About This Home
This home is located at 4 Aberdeen St, Salem, MA 01970 and is currently estimated at $713,627, approximately $343 per square foot. 4 Aberdeen St is a home located in Essex County with nearby schools including Witchcraft Heights Elementary School, Horace Mann Laboratory, and Bates Elementary School.
Ownership History
Date
Name
Owned For
Owner Type
Purchase Details
Closed on
Aug 6, 2004
Sold by
Austin Kirten H and Austin Scott
Bought by
Austin Scott R
Current Estimated Value
Purchase Details
Closed on
Dec 20, 2002
Sold by
Bucyk Ex Karen A and White Raymond T
Bought by
Austin Scott R and Yale Kirsten H
Create a Home Valuation Report for This Property
The Home Valuation Report is an in-depth analysis detailing your home's value as well as a comparison with similar homes in the area
Home Values in the Area
Average Home Value in this Area
Purchase History
| Date | Buyer | Sale Price | Title Company |
|---|---|---|---|
| Austin Scott R | -- | -- | |
| Austin Scott R | $286,000 | -- |
Source: Public Records
Mortgage History
| Date | Status | Borrower | Loan Amount |
|---|---|---|---|
| Open | Austin Scott R | $278,000 | |
| Closed | Austin Scott R | $320,000 | |
| Closed | Austin Scott R | $30,000 |
Source: Public Records
Tax History
| Year | Tax Paid | Tax Assessment Tax Assessment Total Assessment is a certain percentage of the fair market value that is determined by local assessors to be the total taxable value of land and additions on the property. | Land | Improvement |
|---|---|---|---|---|
| 2025 | $6,381 | $562,700 | $190,300 | $372,400 |
| 2024 | $6,526 | $561,600 | $190,300 | $371,300 |
| 2023 | $6,304 | $503,900 | $174,200 | $329,700 |
| 2022 | $6,112 | $461,300 | $167,700 | $293,600 |
| 2021 | $6,105 | $442,400 | $167,700 | $274,700 |
| 2020 | $6,221 | $430,500 | $158,000 | $272,500 |
| 2019 | $6,194 | $410,200 | $150,300 | $259,900 |
| 2018 | $5,894 | $383,200 | $143,200 | $240,000 |
| 2017 | $5,672 | $357,600 | $135,500 | $222,100 |
| 2016 | $5,350 | $341,400 | $119,300 | $222,100 |
| 2015 | $5,176 | $315,400 | $109,700 | $205,700 |
Source: Public Records
Map
Nearby Homes
- 176 Marlborough Rd
- 2 Osborne St
- 1 Fountain St
- 55 Summit St
- 15 Swampscott Ave
- 98 Foster St
- 15 Wall St
- 111 Foster St Unit 416
- 111 Foster St Unit 305
- 80 Foster St Unit 501
- 64 Foster St Unit 105
- 10 Park St
- 4 Valley St
- 145 Boston St
- 11 Osborne Hill Dr
- 128 Boston St Unit 4
- 75 Walnut St Unit 315
- 46 Walnut St
- 48 Franklin St
- 23 Proctor St
Your Personal Tour Guide
Ask me questions while you tour the home.