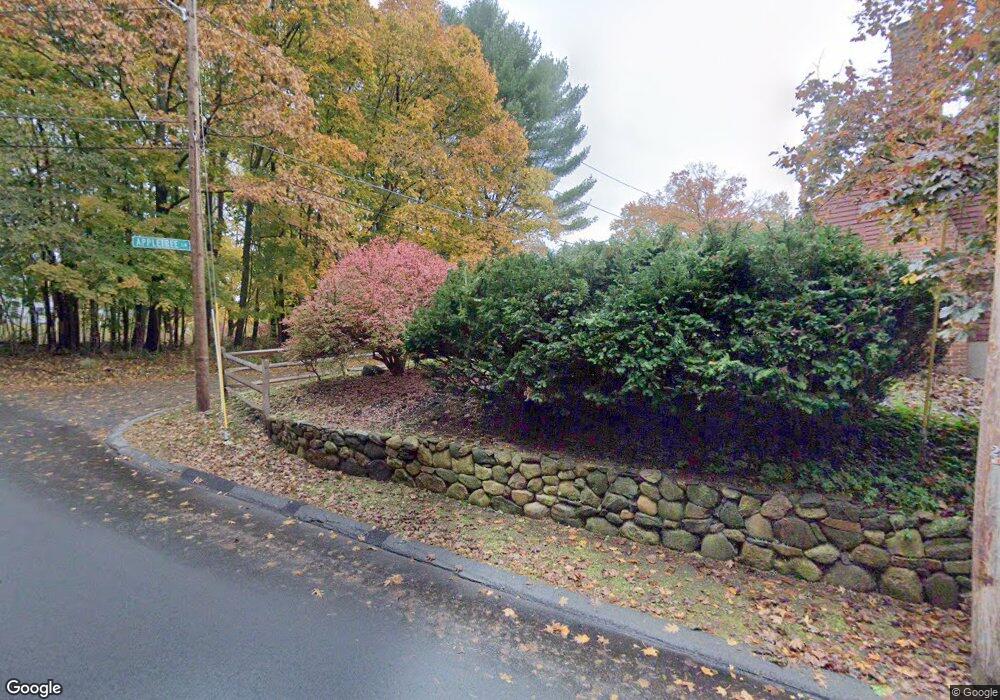
4 Appletree Ln Andover, MA 01810
Phillips Academy NeighborhoodEstimated Value: $901,000 - $999,000
3
Beds
2
Baths
1,883
Sq Ft
$508/Sq Ft
Est. Value
About This Home
This home is located at 4 Appletree Ln, Andover, MA 01810 and is currently estimated at $956,279, approximately $507 per square foot. 4 Appletree Ln is a home located in Essex County with nearby schools including Bancroft Elementary School, Doherty Middle School, and Andover High School.
Ownership History
Date
Name
Owned For
Owner Type
Purchase Details
Closed on
Apr 18, 2025
Sold by
4 Appletree Lane T and Sullivan
Bought by
Ess T T and Ess Sullivan
Current Estimated Value
Purchase Details
Closed on
Feb 21, 2025
Sold by
Sullivan Edward R and Sullivan Eleanor T
Bought by
4 Appletree Ln T and Sullivan
Purchase Details
Closed on
Oct 1, 1973
Bought by
Sullivan Edward R and Sullivan Eleanor T
Create a Home Valuation Report for This Property
The Home Valuation Report is an in-depth analysis detailing your home's value as well as a comparison with similar homes in the area
Home Values in the Area
Average Home Value in this Area
Purchase History
| Date | Buyer | Sale Price | Title Company |
|---|---|---|---|
| Ess T T | -- | None Available | |
| Ess T T | -- | None Available | |
| 4 Appletree Ln T | -- | None Available | |
| 4 Appletree Ln T | -- | None Available | |
| Sullivan Edward R | $45,000 | -- |
Source: Public Records
Mortgage History
| Date | Status | Borrower | Loan Amount |
|---|---|---|---|
| Previous Owner | Sullivan Edward R | $45,000 | |
| Previous Owner | Sullivan Edward R | $45,000 |
Source: Public Records
Tax History
| Year | Tax Paid | Tax Assessment Tax Assessment Total Assessment is a certain percentage of the fair market value that is determined by local assessors to be the total taxable value of land and additions on the property. | Land | Improvement |
|---|---|---|---|---|
| 2024 | $10,792 | $837,900 | $513,900 | $324,000 |
| 2023 | $10,309 | $754,700 | $462,800 | $291,900 |
| 2022 | $9,762 | $668,600 | $402,500 | $266,100 |
| 2021 | $9,325 | $609,900 | $365,900 | $244,000 |
| 2020 | $8,943 | $595,800 | $357,200 | $238,600 |
| 2019 | $8,530 | $558,600 | $326,300 | $232,300 |
| 2018 | $8,241 | $526,900 | $313,700 | $213,200 |
| 2017 | $7,877 | $518,900 | $307,600 | $211,300 |
| 2016 | $7,690 | $518,900 | $307,600 | $211,300 |
| 2015 | $7,407 | $494,800 | $295,800 | $199,000 |
Source: Public Records
Map
Nearby Homes
Your Personal Tour Guide
Ask me questions while you tour the home.