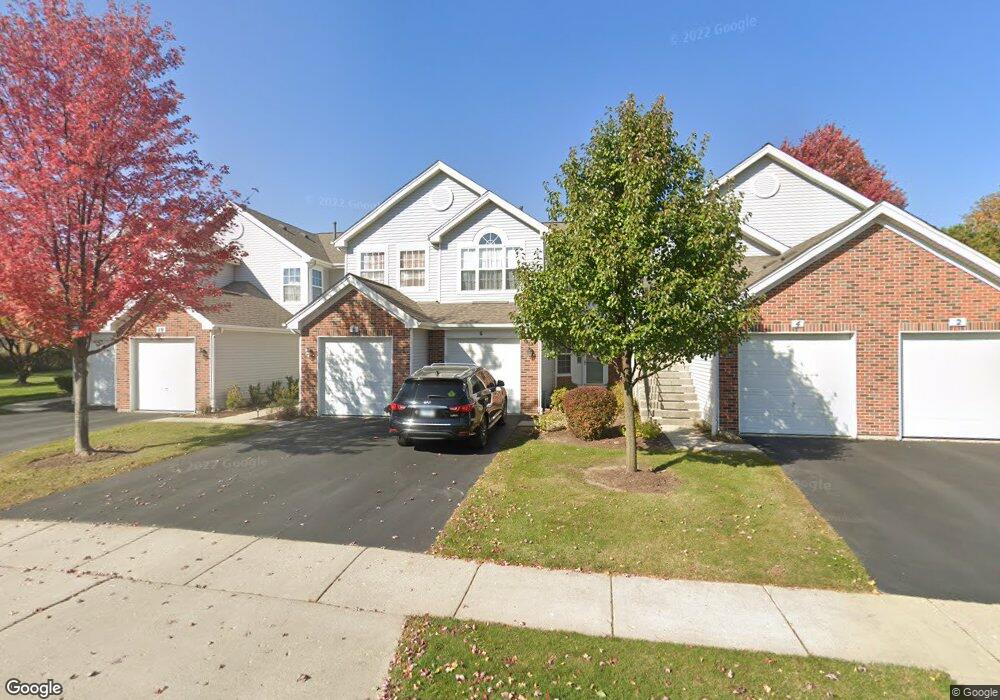
4 Arbordale Ct Unit 4265 Algonquin, IL 60102
Estimated Value: $221,000 - $244,000
2
Beds
1
Bath
1,207
Sq Ft
$193/Sq Ft
Est. Value
About This Home
This home is located at 4 Arbordale Ct Unit 4265, Algonquin, IL 60102 and is currently estimated at $233,488, approximately $193 per square foot. 4 Arbordale Ct Unit 4265 is a home located in Kane County with nearby schools including Westfield Community School, United Junior High School, and Harry D Jacobs High School.
Ownership History
Date
Name
Owned For
Owner Type
Purchase Details
Closed on
Jul 8, 2019
Sold by
Gorges Todd C
Bought by
Infusino Joseph
Current Estimated Value
Home Financials for this Owner
Home Financials are based on the most recent Mortgage that was taken out on this home.
Original Mortgage
$75,000
Outstanding Balance
$65,814
Interest Rate
3.9%
Mortgage Type
Commercial
Estimated Equity
$167,674
Purchase Details
Closed on
May 27, 2004
Sold by
Abel Carol M
Bought by
Gorges Todd C
Home Financials for this Owner
Home Financials are based on the most recent Mortgage that was taken out on this home.
Original Mortgage
$144,045
Interest Rate
6.06%
Mortgage Type
FHA
Purchase Details
Closed on
Aug 9, 2000
Sold by
Higgins Helen M
Bought by
Abel Carol M
Purchase Details
Closed on
May 12, 1995
Sold by
Willoughby Farms Townhomes Ltd Prtnrshp
Bought by
Higgins Helen
Create a Home Valuation Report for This Property
The Home Valuation Report is an in-depth analysis detailing your home's value as well as a comparison with similar homes in the area
Home Values in the Area
Average Home Value in this Area
Purchase History
| Date | Buyer | Sale Price | Title Company |
|---|---|---|---|
| Infusino Joseph | $137,500 | Fox Title Company | |
| Gorges Todd C | $148,500 | Chicago Title Insurance Comp | |
| Abel Carol M | $118,500 | -- | |
| Higgins Helen | $104,000 | Chicago Title Insurance Co |
Source: Public Records
Mortgage History
| Date | Status | Borrower | Loan Amount |
|---|---|---|---|
| Open | Infusino Joseph | $75,000 | |
| Previous Owner | Gorges Todd C | $144,045 |
Source: Public Records
Tax History Compared to Growth
Tax History
| Year | Tax Paid | Tax Assessment Tax Assessment Total Assessment is a certain percentage of the fair market value that is determined by local assessors to be the total taxable value of land and additions on the property. | Land | Improvement |
|---|---|---|---|---|
| 2024 | $4,043 | $61,171 | $8,371 | $52,800 |
| 2023 | $3,829 | $55,040 | $7,532 | $47,508 |
| 2022 | $3,607 | $49,158 | $7,532 | $41,626 |
| 2021 | $3,485 | $46,415 | $7,112 | $39,303 |
| 2020 | $3,411 | $45,371 | $6,952 | $38,419 |
| 2019 | $3,292 | $43,071 | $6,600 | $36,471 |
| 2018 | $2,953 | $38,023 | $6,469 | $31,554 |
| 2017 | $2,811 | $35,568 | $6,051 | $29,517 |
| 2016 | $2,871 | $34,439 | $5,859 | $28,580 |
| 2015 | -- | $26,685 | $5,490 | $21,195 |
| 2014 | -- | $25,948 | $5,338 | $20,610 |
| 2013 | -- | $29,288 | $5,501 | $23,787 |
Source: Public Records
Map
Nearby Homes
- 30 Arbordale Ct Unit 4284
- 1900 Waverly Ln
- 2101 Peach Tree Ln Unit 4094
- 1971 Peach Tree Ln
- 2043 Peach Tree Ln Unit 4122
- 000 County Line Rd
- Marianne Plan at Algonquin Meadows - Traditional Townhomes
- Darcy Plan at Algonquin Meadows - Traditional Townhomes
- Charlotte Plan at Algonquin Meadows - Traditional Townhomes
- 2161 Burnham Ct
- Adams Plan at Algonquin Meadows - Single Family
- Sequoia Plan at Algonquin Meadows - Single Family
- Bryce Plan at Algonquin Meadows - Single Family
- Rainier Plan at Algonquin Meadows - Single Family
- Santa Rosa Plan at Algonquin Meadows - Single Family
- Biscayne Plan at Algonquin Meadows - Single Family
- Amherst Plan at Algonquin Meadows - Urban Townhomes
- Chatham Plan at Algonquin Meadows - Urban Townhomes
- Chelsea Plan at Algonquin Meadows - Urban Townhomes
- 12 White Oak Ct
- 2 Arbordale Ct Unit 4266
- 6 Arbordale Ct Unit 4264
- 12 Arbordale Ct Unit 4261
- 10 Arbordale Ct Unit 4262
- 8 Arbordale Ct Unit 4263
- 4 Arbordale Ct Unit 4
- 14 Arbordale Ct Unit 4276
- 22 Arbordale Ct Unit 4272
- 20 Arbordale Ct Unit 4273
- 24 Arbordale Ct Unit 4271
- 16 Arbordale Ct Unit 4275
- 18 Arbordale Ct Unit 4274
- 1850 Arbordale Ln
- 34 Arbordale Ct Unit 4282
- 28 Arbordale Ct Unit 4285
- 32 Arbordale Ct Unit 4283
- 36 Arbordale Ct Unit 4281
- 26 Arbordale Ct Unit 4286
- 1840 Arbordale Ln
- 1871 Arbordale Ln