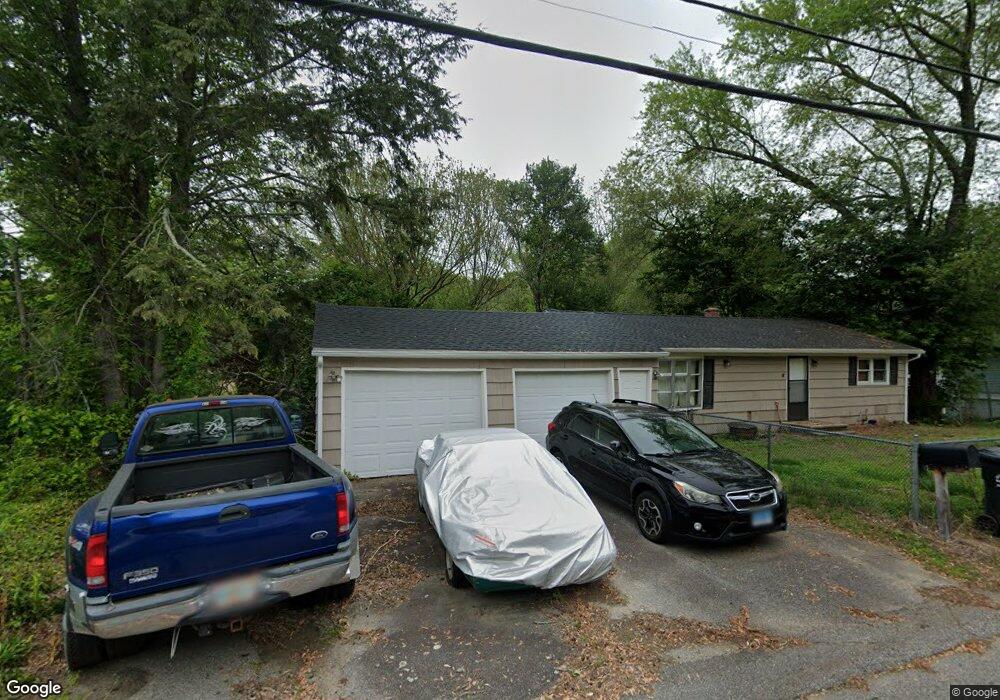
4 Arrowhead Dr Ledyard, CT 06339
Estimated Value: $281,000 - $352,000
2
Beds
1
Bath
960
Sq Ft
$343/Sq Ft
Est. Value
About This Home
This home is located at 4 Arrowhead Dr, Ledyard, CT 06339 and is currently estimated at $329,095, approximately $342 per square foot. 4 Arrowhead Dr is a home located in New London County with nearby schools including Ledyard Middle School, Ledyard High School, and Integrated Day Charter School.
Ownership History
Date
Name
Owned For
Owner Type
Purchase Details
Closed on
Dec 16, 2008
Sold by
Emc Mortgage Corp
Bought by
Clemens James W
Current Estimated Value
Home Financials for this Owner
Home Financials are based on the most recent Mortgage that was taken out on this home.
Original Mortgage
$142,698
Outstanding Balance
$95,930
Interest Rate
6.49%
Estimated Equity
$233,165
Purchase Details
Closed on
May 16, 2006
Sold by
Robinson Eugene P and Robinson Dianne J
Bought by
Brown Roger A
Home Financials for this Owner
Home Financials are based on the most recent Mortgage that was taken out on this home.
Original Mortgage
$218,500
Interest Rate
6.4%
Purchase Details
Closed on
May 8, 2000
Sold by
Koerting Claudia P
Bought by
Robinson Eugene P and Robinson Diane J
Home Financials for this Owner
Home Financials are based on the most recent Mortgage that was taken out on this home.
Original Mortgage
$70,000
Interest Rate
8.21%
Create a Home Valuation Report for This Property
The Home Valuation Report is an in-depth analysis detailing your home's value as well as a comparison with similar homes in the area
Home Values in the Area
Average Home Value in this Area
Purchase History
| Date | Buyer | Sale Price | Title Company |
|---|---|---|---|
| Clemens James W | $139,900 | -- | |
| Brown Roger A | $230,000 | -- | |
| Robinson Eugene P | $108,000 | -- |
Source: Public Records
Mortgage History
| Date | Status | Borrower | Loan Amount |
|---|---|---|---|
| Open | Robinson Eugene P | $142,698 | |
| Previous Owner | Robinson Eugene P | $218,500 | |
| Previous Owner | Robinson Eugene P | $70,000 | |
| Previous Owner | Robinson Eugene P | $75,000 |
Source: Public Records
Tax History
| Year | Tax Paid | Tax Assessment Tax Assessment Total Assessment is a certain percentage of the fair market value that is determined by local assessors to be the total taxable value of land and additions on the property. | Land | Improvement |
|---|---|---|---|---|
| 2025 | $4,869 | $131,107 | $61,107 | $70,000 |
| 2024 | $4,604 | $130,757 | $61,107 | $69,650 |
| 2023 | $4,519 | $130,757 | $61,107 | $69,650 |
| 2022 | $4,422 | $130,757 | $61,107 | $69,650 |
| 2021 | $4,393 | $130,757 | $61,107 | $69,650 |
| 2020 | $4,012 | $114,730 | $55,020 | $59,710 |
| 2019 | $4,022 | $114,730 | $55,020 | $59,710 |
| 2018 | $3,934 | $114,730 | $55,020 | $59,710 |
| 2017 | $3,733 | $114,730 | $55,020 | $59,710 |
| 2016 | $3,660 | $114,730 | $55,020 | $59,710 |
| 2015 | $3,488 | $114,730 | $55,020 | $59,710 |
| 2014 | $3,705 | $121,870 | $55,020 | $66,850 |
Source: Public Records
Map
Nearby Homes
- 7 Barn Rd
- 104 Route 2a
- 11 Willow Ln
- 36 Route 2a
- 15 Paster Rd
- 3 Holdsworth Rd
- 16 Marlene Dr
- 10 Buttercup Ln
- 48 Bittersweet Dr
- 1918 Route 12
- 31 Woodland Dr
- 552 Laurel Hill Rd
- 12 Stonybrook Rd
- 134 Massapeag Side Rd
- 5 Mount Laurel Rd
- 23 Avery Hill Rd
- 547 Old Laurel Hill Rd
- 55 Bentley Ave
- 14 Abbey Rd
- 6 Overlook Rd
- 2 Arrowhead Dr
- 8 Arrowhead Dr
- 7 Arrowhead Dr
- 259 Avery Hill Rd
- 12 Cider Mill Rd
- 9 Arrowhead Dr
- 253 Avery Hill Rd
- 11 Barn Rd
- 12 Arrowhead Dr
- 11 Arrowhead Dr
- 7 Cider Mill Rd
- 9 Barn Rd
- 14 Arrowhead Dr
- 13 Arrowhead Dr
- 249 Avery Hill Rd
- 5 Shingle Point Rd
- 12 Barn Rd
- 16 Arrowhead Dr
- 15 Arrowhead Dr
- 9 Shingle Point Rd
Your Personal Tour Guide
Ask me questions while you tour the home.