Estimated Value: $161,568 - $224,000
--
Bed
--
Bath
1,275
Sq Ft
$159/Sq Ft
Est. Value
About This Home
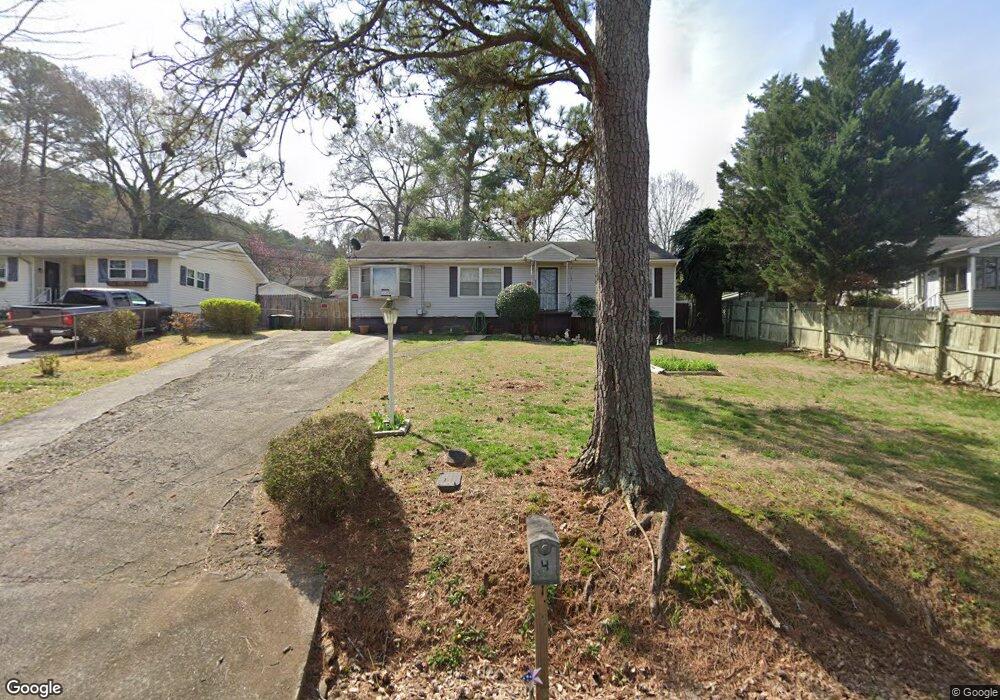
This home is located at 4 Azalea St SE, Rome, GA 30161 and is currently estimated at $202,892, approximately $159 per square foot. 4 Azalea St SE is a home located in Floyd County with nearby schools including Pepperell Middle School, Pepperell High School, and Montessori School of Rome.
Ownership History
Date
Name
Owned For
Owner Type
Purchase Details
Closed on
May 14, 2002
Sold by
Battle Odell and Battle Jean H
Bought by
Battle Jean H
Current Estimated Value
Purchase Details
Closed on
Sep 22, 1998
Sold by
Battle Odell
Bought by
Battle Odell and Battle Jean H
Purchase Details
Closed on
Feb 17, 1998
Sold by
Dupree Leon
Bought by
Battle Odell
Purchase Details
Closed on
Dec 3, 1988
Sold by
Fielder Napoleon and Belinda Searcy Fi
Bought by
Dupree Leon
Purchase Details
Closed on
Sep 5, 1979
Sold by
Kay Lawrence E and Kay Lawrence E Karen O
Bought by
Fielder Napoleon and Belinda Sear
Purchase Details
Closed on
Dec 20, 1967
Sold by
Hyde Fred H and Hyde Fred H Ruth F
Bought by
Kay Lawrence E and Kay Lawren Karen O
Purchase Details
Closed on
Jan 11, 1963
Sold by
Abney Robt B Abney Robt B Abney Robt
Bought by
Hyde Fred H and Hyde Fred H Ruth F
Purchase Details
Closed on
Oct 1, 1955
Bought by
Abney Robt B Abney Robt B Abney Rob
Create a Home Valuation Report for This Property
The Home Valuation Report is an in-depth analysis detailing your home's value as well as a comparison with similar homes in the area
Home Values in the Area
Average Home Value in this Area
Purchase History
| Date | Buyer | Sale Price | Title Company |
|---|---|---|---|
| Battle Jean H | -- | -- | |
| Battle Odell | -- | -- | |
| Battle Odell | $42,000 | -- | |
| Dupree Leon | $11,400 | -- | |
| Fielder Napoleon | $27,500 | -- | |
| Kay Lawrence E | $12,200 | -- | |
| Hyde Fred H | -- | -- | |
| Abney Robt B Abney Robt B Abney Rob | -- | -- |
Source: Public Records
Tax History Compared to Growth
Tax History
| Year | Tax Paid | Tax Assessment Tax Assessment Total Assessment is a certain percentage of the fair market value that is determined by local assessors to be the total taxable value of land and additions on the property. | Land | Improvement |
|---|---|---|---|---|
| 2024 | $1,866 | $58,232 | $8,640 | $49,592 |
| 2023 | $1,716 | $55,117 | $7,680 | $47,437 |
| 2022 | $1,394 | $45,274 | $6,400 | $38,874 |
| 2021 | $1,156 | $36,646 | $6,400 | $30,246 |
| 2020 | $1,056 | $33,143 | $4,800 | $28,343 |
| 2019 | $875 | $27,655 | $4,800 | $22,855 |
| 2018 | $826 | $26,042 | $4,800 | $21,242 |
| 2017 | $798 | $25,065 | $4,800 | $20,265 |
| 2016 | $836 | $25,977 | $4,800 | $21,177 |
| 2015 | $819 | $25,977 | $4,800 | $21,177 |
| 2014 | $819 | $25,977 | $4,800 | $21,177 |
Source: Public Records
Map
Nearby Homes
- 2501 Maple Rd SE
- 2508 Maple Rd SE
- 2523 Maple Rd SE
- 107 E Linden St SE
- 211 Alfred Ave SE
- 212 Alfred Ave SE
- 226 Flora Ave SE
- 36 Saddle Mountain Rd SE
- 2710 Maple Rd SE
- 0 Martha Berry Hwy Unit 7525627
- 0 Martha Berry Hwy Unit 7614774
- 0 Martha Berry Hwy Unit 10563404
- 2108 Maple Ave SW
- 3 Belmont Ct SE
- 7 Willingham St SW
- 15 Saddlebrook Dr SE
- 2107 Rockmart Rd SE
- 2812 Maple Rd SE
- 109 Chateau Dr SE
- 6 Azalea St SE
- 2 Azalea St SE
- 7 Wisteria Dr SE
- 8 Azalea St SE
- 5 Wisteria Dr SE
- 9 Wisteria Dr SE
- 0 Azalea St SE Unit 7374687
- 0 Azalea St SE Unit 7620231
- 0 Azalea St SE Unit 7418596
- 0 Azalea St SE Unit 3130564
- 0 Azalea St SE
- 5 Azalea St SE
- 7 Flora Ave SE
- 7 Azalea St SE
- 3 SE Wisteria Drive Southeast Dr SE
- 11 Wisteria Dr SE
- 1 Azalea St SE
- 10 Azalea St SE
- 9 Azalea St SE Unit 16
- 9 Azalea St SE