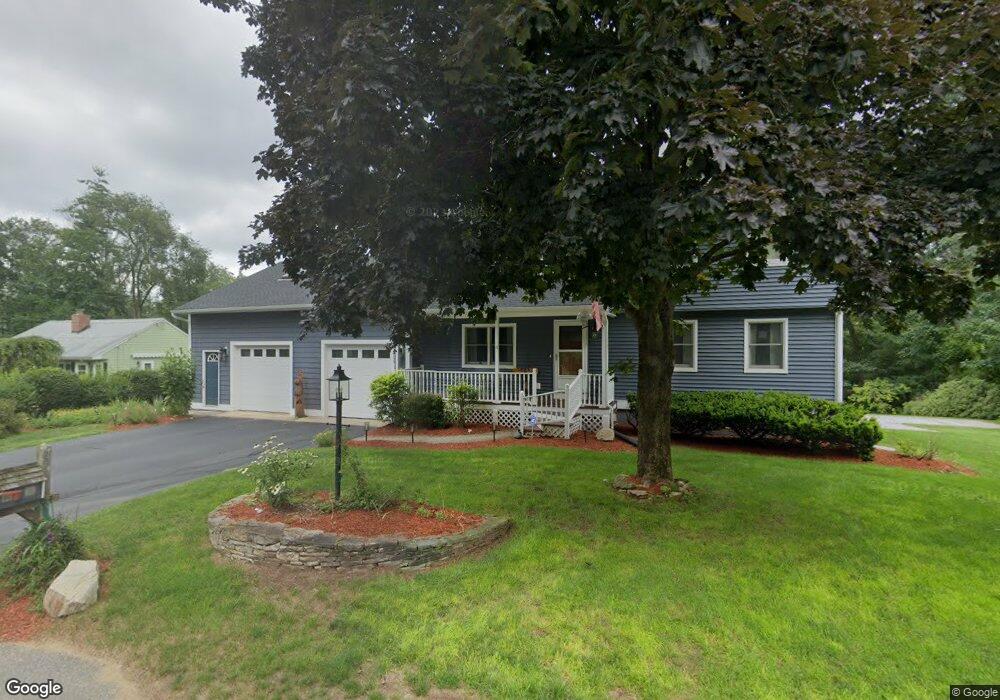
4 Baker Rd Windham, NH 03087
Estimated Value: $828,330 - $999,000
3
Beds
3
Baths
3,654
Sq Ft
$247/Sq Ft
Est. Value
About This Home
This home is located at 4 Baker Rd, Windham, NH 03087 and is currently estimated at $903,833, approximately $247 per square foot. 4 Baker Rd is a home located in Rockingham County with nearby schools including Golden Brook Elementary School, Windham Middle School, and Windham High School.
Ownership History
Date
Name
Owned For
Owner Type
Purchase Details
Closed on
Apr 4, 2011
Sold by
Delaney Scott M and Delaney Denise
Bought by
Dorsheimer Joseph M and Dorsheimer Amy E
Current Estimated Value
Home Financials for this Owner
Home Financials are based on the most recent Mortgage that was taken out on this home.
Original Mortgage
$331,987
Outstanding Balance
$231,594
Interest Rate
5.04%
Mortgage Type
Purchase Money Mortgage
Estimated Equity
$672,239
Create a Home Valuation Report for This Property
The Home Valuation Report is an in-depth analysis detailing your home's value as well as a comparison with similar homes in the area
Home Values in the Area
Average Home Value in this Area
Purchase History
| Date | Buyer | Sale Price | Title Company |
|---|---|---|---|
| Dorsheimer Joseph M | $346,000 | -- |
Source: Public Records
Mortgage History
| Date | Status | Borrower | Loan Amount |
|---|---|---|---|
| Open | Dorsheimer Joseph M | $331,987 |
Source: Public Records
Tax History
| Year | Tax Paid | Tax Assessment Tax Assessment Total Assessment is a certain percentage of the fair market value that is determined by local assessors to be the total taxable value of land and additions on the property. | Land | Improvement |
|---|---|---|---|---|
| 2024 | $10,783 | $476,300 | $163,800 | $312,500 |
| 2023 | $10,193 | $476,300 | $163,800 | $312,500 |
| 2022 | $8,655 | $438,000 | $163,800 | $274,200 |
| 2021 | $8,156 | $438,000 | $163,800 | $274,200 |
| 2020 | $8,379 | $438,000 | $163,800 | $274,200 |
| 2019 | $7,651 | $339,300 | $150,200 | $189,100 |
| 2018 | $6,579 | $339,300 | $150,200 | $189,100 |
| 2017 | $6,854 | $339,300 | $150,200 | $189,100 |
| 2016 | $7,404 | $339,300 | $150,200 | $189,100 |
| 2015 | $7,370 | $339,300 | $150,200 | $189,100 |
| 2014 | $7,531 | $313,800 | $148,000 | $165,800 |
| 2013 | $8,133 | $344,600 | $148,000 | $196,600 |
Source: Public Records
Map
Nearby Homes
- 47 Cobbetts Pond Rd
- 48 Marblehead Rd
- 6 Chadwick Cir
- 108 S Shore Rd
- 5 Johnson St
- 4 Arbor Rd
- 16 Arbor Rd
- 98 Trails Edge Rd
- 54 Enterprise Dr
- 6-18 Mary Anthony Dr
- 47 Campbell St
- 23 Ryan Farm Rd
- 56 Nelson St
- 30 Winter St
- 4 Rosemary St
- 18 Winter St
- 2 Cypress Ln
- 7 Cypress Ln Unit 5
- 4 Cypress Ln Unit 10
- 92 Lowell Rd
Your Personal Tour Guide
Ask me questions while you tour the home.