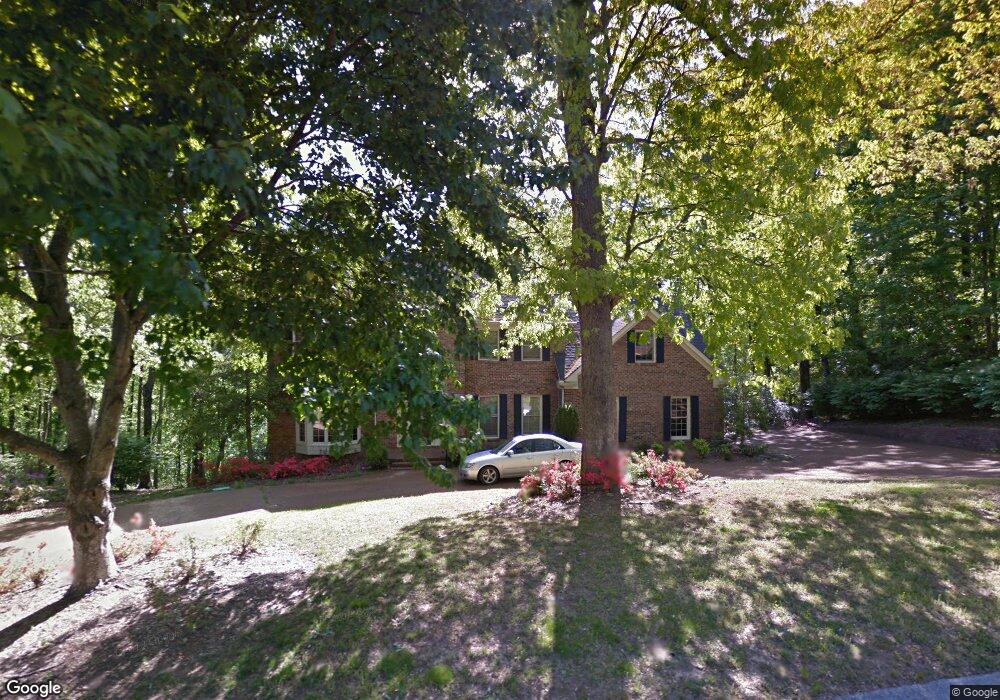
4 Balfour Ct Unit 1 Signal Mountain, TN 37377
Estimated Value: $865,000 - $1,005,000
5
Beds
4
Baths
5,273
Sq Ft
$180/Sq Ft
Est. Value
About This Home
This home is located at 4 Balfour Ct Unit 1, Signal Mountain, TN 37377 and is currently estimated at $948,324, approximately $179 per square foot. 4 Balfour Ct Unit 1 is a home located in Hamilton County with nearby schools including Thrasher Elementary School and Signal Mountain Middle/High School.
Ownership History
Date
Name
Owned For
Owner Type
Purchase Details
Closed on
Apr 21, 2021
Sold by
Mississippi American Life Insurance Co
Bought by
Moore Alan L
Current Estimated Value
Purchase Details
Closed on
Apr 29, 2013
Sold by
Hunnewell Scott W and Hunnewell Peggy
Bought by
Edwards Rachel Elaine and Edwards Daniel Eugene
Home Financials for this Owner
Home Financials are based on the most recent Mortgage that was taken out on this home.
Original Mortgage
$380,000
Interest Rate
3.59%
Mortgage Type
New Conventional
Purchase Details
Closed on
Apr 29, 2009
Sold by
Funderburk Randall L and Funderburk Carolyn S
Bought by
Hunnewell Scott and Hunnewell Peggy
Home Financials for this Owner
Home Financials are based on the most recent Mortgage that was taken out on this home.
Original Mortgage
$348,000
Interest Rate
5.01%
Mortgage Type
Purchase Money Mortgage
Create a Home Valuation Report for This Property
The Home Valuation Report is an in-depth analysis detailing your home's value as well as a comparison with similar homes in the area
Home Values in the Area
Average Home Value in this Area
Purchase History
| Date | Buyer | Sale Price | Title Company |
|---|---|---|---|
| Moore Alan L | $102,709 | Realty Title & Escrow | |
| Edwards Rachel Elaine | $400,000 | Title Insurance Company Of C | |
| Hunnewell Scott | $435,000 | Title Guaranty & Trust |
Source: Public Records
Mortgage History
| Date | Status | Borrower | Loan Amount |
|---|---|---|---|
| Previous Owner | Edwards Rachel Elaine | $380,000 | |
| Previous Owner | Hunnewell Scott | $348,000 |
Source: Public Records
Tax History Compared to Growth
Tax History
| Year | Tax Paid | Tax Assessment Tax Assessment Total Assessment is a certain percentage of the fair market value that is determined by local assessors to be the total taxable value of land and additions on the property. | Land | Improvement |
|---|---|---|---|---|
| 2024 | $3,290 | $147,050 | $0 | $0 |
| 2023 | $3,290 | $147,050 | $0 | $0 |
| 2022 | $3,290 | $147,050 | $0 | $0 |
| 2021 | $3,290 | $147,050 | $0 | $0 |
| 2020 | $3,893 | $140,800 | $0 | $0 |
| 2019 | $3,893 | $140,800 | $0 | $0 |
| 2018 | $3,893 | $140,800 | $0 | $0 |
| 2017 | $3,893 | $140,800 | $0 | $0 |
| 2016 | $3,289 | $0 | $0 | $0 |
| 2015 | $3,289 | $118,925 | $0 | $0 |
| 2014 | $3,289 | $0 | $0 | $0 |
Source: Public Records
Map
Nearby Homes
- 15 Grayswood Hill Rd
- 14 Carriage Hill
- 122 Green Gorge Rd
- 905 Ridgeway Ave
- 204 Mathes Ln
- 779 James Blvd
- 853 Kentucky Ave
- 1425 Palisades Rd
- 928 Ridgeway Ave
- 907 Kentucky Ave
- 321 Signal Mountain Blvd
- 1521 Sunset Dr
- 1425 Sunset Dr
- 1419 Sunset Dr
- 958 Signal Rd
- 102 Sunnybrook Trail
- 1018 Ridgeway Ave
- 421 Timberlinks Dr
- 422 Timberlinks Dr
- 533 Fern Trail
- 4 Balfour Ct
- 2 Balfour Ct
- 6 Balfour Ct
- 6 Balfour Ct Unit 4
- 6 Balfour Ct Unit 171
- 222 Lamplighter Ln
- 222 Lamplighter Ln Unit 5
- 229 Lamplighter Ln
- 3 Balfour Ct
- 15 Grayswood Hill Rd Unit 332
- 15 Grayswood Hill Rd Unit 151
- 0 Balfour Ct
- 0 Balfour Ct Unit 1192534
- 0 Balfour Ct Unit 1202552
- 11 Grayswood Hill Rd
- 11 Grayswood Hill Rd Unit 332
- 198 Lamplighter Ln
- 17 Grayswood Hill Rd
- 12 Grayswood Hill Rd
- 205 Lamplighter Ln