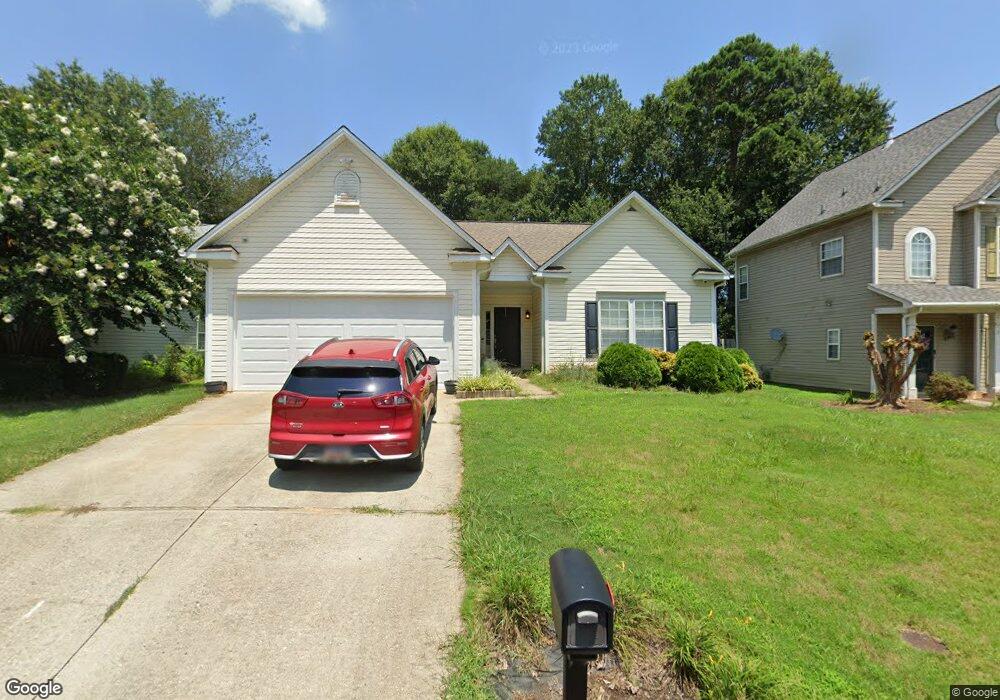
4 Bathurst Ln Simpsonville, SC 29681
Estimated Value: $317,397 - $327,000
3
Beds
2
Baths
1,735
Sq Ft
$186/Sq Ft
Est. Value
About This Home
This home is located at 4 Bathurst Ln, Simpsonville, SC 29681 and is currently estimated at $322,349, approximately $185 per square foot. 4 Bathurst Ln is a home located in Greenville County with nearby schools including Bell's Crossing Elementary School, Hillcrest Middle School, and Hillcrest High School.
Ownership History
Date
Name
Owned For
Owner Type
Purchase Details
Closed on
Jun 6, 2016
Sold by
Horell Christopher
Bought by
Bacigalupi Tia V and Bacigalupi Michael L
Current Estimated Value
Home Financials for this Owner
Home Financials are based on the most recent Mortgage that was taken out on this home.
Original Mortgage
$164,957
Outstanding Balance
$134,722
Interest Rate
4.4%
Mortgage Type
FHA
Estimated Equity
$187,627
Purchase Details
Closed on
Oct 25, 2006
Sold by
Knight John
Bought by
Horrell Christopher
Home Financials for this Owner
Home Financials are based on the most recent Mortgage that was taken out on this home.
Original Mortgage
$116,911
Interest Rate
9.8%
Mortgage Type
Stand Alone First
Purchase Details
Closed on
Jun 29, 2004
Sold by
Secretary Of Housing And Urban
Bought by
Knight John
Purchase Details
Closed on
Mar 31, 2004
Sold by
Secretary Of Housing And Urban
Bought by
Knight John
Purchase Details
Closed on
Sep 19, 2000
Sold by
R Inc
Bought by
Rter Rhonda S
Create a Home Valuation Report for This Property
The Home Valuation Report is an in-depth analysis detailing your home's value as well as a comparison with similar homes in the area
Home Values in the Area
Average Home Value in this Area
Purchase History
| Date | Buyer | Sale Price | Title Company |
|---|---|---|---|
| Bacigalupi Tia V | $168,000 | None Available | |
| Horrell Christopher | $116,911 | None Available | |
| Knight John | $120,000 | -- | |
| Knight John | $2,500 | -- | |
| Rter Rhonda S | $126,770 | -- |
Source: Public Records
Mortgage History
| Date | Status | Borrower | Loan Amount |
|---|---|---|---|
| Open | Bacigalupi Tia V | $164,957 | |
| Previous Owner | Horrell Christopher | $116,911 |
Source: Public Records
Tax History Compared to Growth
Tax History
| Year | Tax Paid | Tax Assessment Tax Assessment Total Assessment is a certain percentage of the fair market value that is determined by local assessors to be the total taxable value of land and additions on the property. | Land | Improvement |
|---|---|---|---|---|
| 2024 | $1,120 | $7,050 | $1,010 | $6,040 |
| 2023 | $1,120 | $7,050 | $1,010 | $6,040 |
| 2022 | $1,092 | $7,050 | $1,010 | $6,040 |
| 2021 | $1,092 | $7,050 | $1,010 | $6,040 |
| 2020 | $1,005 | $6,130 | $880 | $5,250 |
| 2019 | $1,005 | $6,130 | $880 | $5,250 |
| 2018 | $1,050 | $6,130 | $880 | $5,250 |
| 2017 | $2,820 | $9,200 | $1,320 | $7,880 |
| 2016 | $1,010 | $153,330 | $22,000 | $131,330 |
| 2015 | $1,012 | $153,330 | $22,000 | $131,330 |
| 2014 | $876 | $138,249 | $23,309 | $114,940 |
Source: Public Records
Map
Nearby Homes
- 5 Bathurst Ln
- 220 Waters Run Ln
- 108 Brown Ln
- 409 Heather Falls Ln
- 135 Adams Creek Place
- 217 Lovelace Ct
- 11 Manorwood Ct
- 216 Ashcroft Ln
- 10 Verona Cir
- 8 Ventana Ct
- 117 Oak Valley Dr
- 206 Sun Shower Way
- 206 Squires Creek Rd
- 303 Dunwoody Dr
- 712 Spring Lake Loop
- 111 Autumnwood Way
- 303 Rockland Dr
- 7 Bamburgh Brae Ct
- 401 Ashridge Way
- 5 Grimes Dr
- 2 Bathurst Ln
- 20 Hawkesbury Rd
- 8 Bathurst Ln
- 119 Morell Dr
- 18 Hawkesbury Rd
- 3 Bathurst Ln
- 117 Morell Dr
- 1 Bathurst Ln
- 7 Bathurst Ln
- 16 Hawkesbury Rd
- 23 Hawkesbury Rd
- 25 Hawkesbury Rd
- 115 Morell Dr
- 21 Hawkesbury Rd
- 100 Bathurst Ln
- 27 Hawkesbury Rd Unit 27 Hawkesbury Road
- 27 Hawkesbury Rd
- 19 Hawkesbury Rd
- 102 Hawkesbury Rd
- 14 Hawkesbury Rd