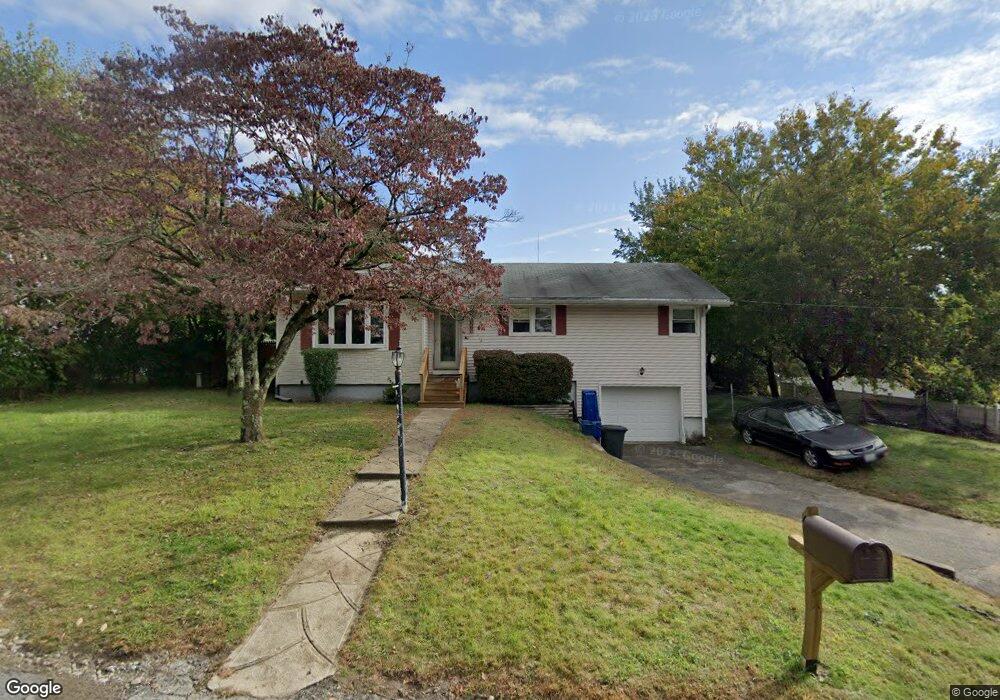
4 Bennett Dr Johnston, RI 02919
Thornton NeighborhoodEstimated Value: $386,000 - $469,000
3
Beds
1
Bath
1,210
Sq Ft
$354/Sq Ft
Est. Value
About This Home
This home is located at 4 Bennett Dr, Johnston, RI 02919 and is currently estimated at $428,387, approximately $354 per square foot. 4 Bennett Dr is a home located in Providence County with nearby schools including Johnston Senior High School and St Rocco School.
Ownership History
Date
Name
Owned For
Owner Type
Purchase Details
Closed on
May 3, 1999
Sold by
Labelle Michael D and Labelle Catherine F
Bought by
Mouradian Tania J
Current Estimated Value
Purchase Details
Closed on
Nov 9, 1995
Sold by
Razza Kenneth W
Bought by
Labelle Michael D and Chisholm Cathrine F
Create a Home Valuation Report for This Property
The Home Valuation Report is an in-depth analysis detailing your home's value as well as a comparison with similar homes in the area
Home Values in the Area
Average Home Value in this Area
Purchase History
| Date | Buyer | Sale Price | Title Company |
|---|---|---|---|
| Mouradian Tania J | $107,000 | -- | |
| Labelle Michael D | $108,000 | -- | |
| Mouradian Tania J | $107,000 | -- | |
| Labelle Michael D | $108,000 | -- |
Source: Public Records
Mortgage History
| Date | Status | Borrower | Loan Amount |
|---|---|---|---|
| Open | Labelle Michael D | $31,000 | |
| Open | Labelle Michael D | $48,000 | |
| Open | Labelle Michael D | $99,000 |
Source: Public Records
Tax History
| Year | Tax Paid | Tax Assessment Tax Assessment Total Assessment is a certain percentage of the fair market value that is determined by local assessors to be the total taxable value of land and additions on the property. | Land | Improvement |
|---|---|---|---|---|
| 2025 | $4,802 | $307,400 | $89,600 | $217,800 |
| 2024 | $4,703 | $307,400 | $89,600 | $217,800 |
| 2023 | $4,703 | $307,400 | $89,600 | $217,800 |
| 2022 | $6,443 | $202,300 | $66,400 | $135,900 |
| 2021 | $4,701 | $202,300 | $66,400 | $135,900 |
| 2018 | $4,305 | $156,600 | $49,400 | $107,200 |
| 2016 | $5,696 | $156,600 | $49,400 | $107,200 |
| 2015 | $4,505 | $155,400 | $49,900 | $105,500 |
| 2014 | $3,574 | $155,400 | $49,900 | $105,500 |
| 2013 | $4,468 | $155,400 | $49,900 | $105,500 |
Source: Public Records
Map
Nearby Homes
- 30 S Bennett Dr
- 1189 Atwood Ave
- 6 Pico Cir
- 5 Pico Cir
- 7 Pico Cir
- 1 Pico Cir
- 16 Shaw Ave
- 32 Harrington Dr
- 5 Deluca St
- 0 Myrtle Ave
- 0 Ipswich St
- 0 Plainfield Pike Unit 1374314
- 50 Clemence St Unit 50
- 9 Baker St
- 73 Maple Ave
- 47 Morgan Ave Unit 37
- 0 Clemence St
- 0 Macera Dr
- 1603 Plainfield Pike Unit G8
- 83 Valente Dr
Your Personal Tour Guide
Ask me questions while you tour the home.