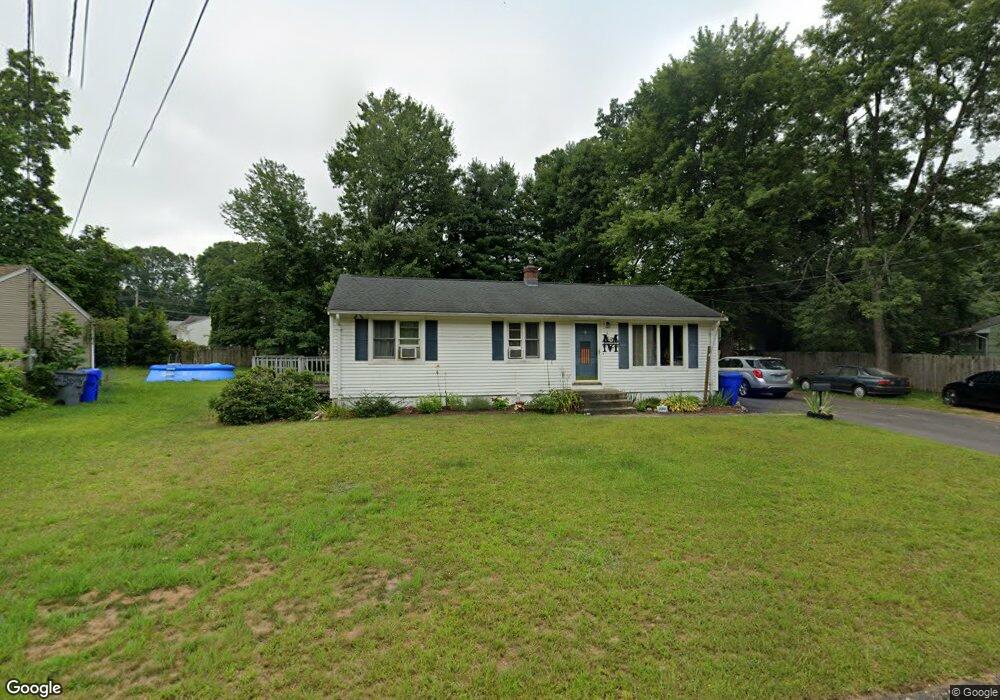
4 Booth St Enfield, CT 06082
Estimated Value: $266,331 - $300,000
3
Beds
1
Bath
1,008
Sq Ft
$287/Sq Ft
Est. Value
About This Home
This home is located at 4 Booth St, Enfield, CT 06082 and is currently estimated at $289,333, approximately $287 per square foot. 4 Booth St is a home located in Hartford County with nearby schools including Prudence Crandall Elementary School, Henry Barnard Elementary School, and Enfield High School.
Ownership History
Date
Name
Owned For
Owner Type
Purchase Details
Closed on
Aug 7, 2009
Sold by
Wlazlo Elizabeth
Bought by
Maggipinto John and Maggipinto Cynthia
Current Estimated Value
Home Financials for this Owner
Home Financials are based on the most recent Mortgage that was taken out on this home.
Original Mortgage
$168,800
Outstanding Balance
$111,509
Interest Rate
5.47%
Estimated Equity
$177,824
Purchase Details
Closed on
Sep 25, 1998
Sold by
Powers Scott and Powers Kathleen
Bought by
Wlazlo Elizabeth
Purchase Details
Closed on
Mar 27, 1997
Sold by
Kope Eugene
Bought by
Powers Scott and Powers Kathleen
Create a Home Valuation Report for This Property
The Home Valuation Report is an in-depth analysis detailing your home's value as well as a comparison with similar homes in the area
Home Values in the Area
Average Home Value in this Area
Purchase History
| Date | Buyer | Sale Price | Title Company |
|---|---|---|---|
| Maggipinto John | $172,000 | -- | |
| Wlazlo Elizabeth | $102,900 | -- | |
| Powers Scott | $100,000 | -- |
Source: Public Records
Mortgage History
| Date | Status | Borrower | Loan Amount |
|---|---|---|---|
| Open | Powers Scott | $168,800 | |
| Closed | Powers Scott | $145,604 | |
| Previous Owner | Powers Scott | $55,000 |
Source: Public Records
Tax History
| Year | Tax Paid | Tax Assessment Tax Assessment Total Assessment is a certain percentage of the fair market value that is determined by local assessors to be the total taxable value of land and additions on the property. | Land | Improvement |
|---|---|---|---|---|
| 2025 | $4,442 | $128,200 | $51,700 | $76,500 |
| 2024 | $4,334 | $128,200 | $51,700 | $76,500 |
| 2023 | $4,264 | $128,200 | $51,700 | $76,500 |
| 2022 | $3,922 | $128,200 | $51,700 | $76,500 |
| 2021 | $3,674 | $98,300 | $40,780 | $57,520 |
| 2020 | $3,674 | $98,300 | $40,780 | $57,520 |
| 2019 | $3,674 | $98,300 | $40,780 | $57,520 |
| 2018 | $3,593 | $98,300 | $40,780 | $57,520 |
| 2017 | $3,399 | $98,300 | $40,780 | $57,520 |
| 2016 | $3,460 | $101,740 | $45,670 | $56,070 |
| 2015 | $3,361 | $101,740 | $45,670 | $56,070 |
| 2014 | $3,284 | $101,740 | $45,670 | $56,070 |
Source: Public Records
Map
Nearby Homes
Your Personal Tour Guide
Ask me questions while you tour the home.