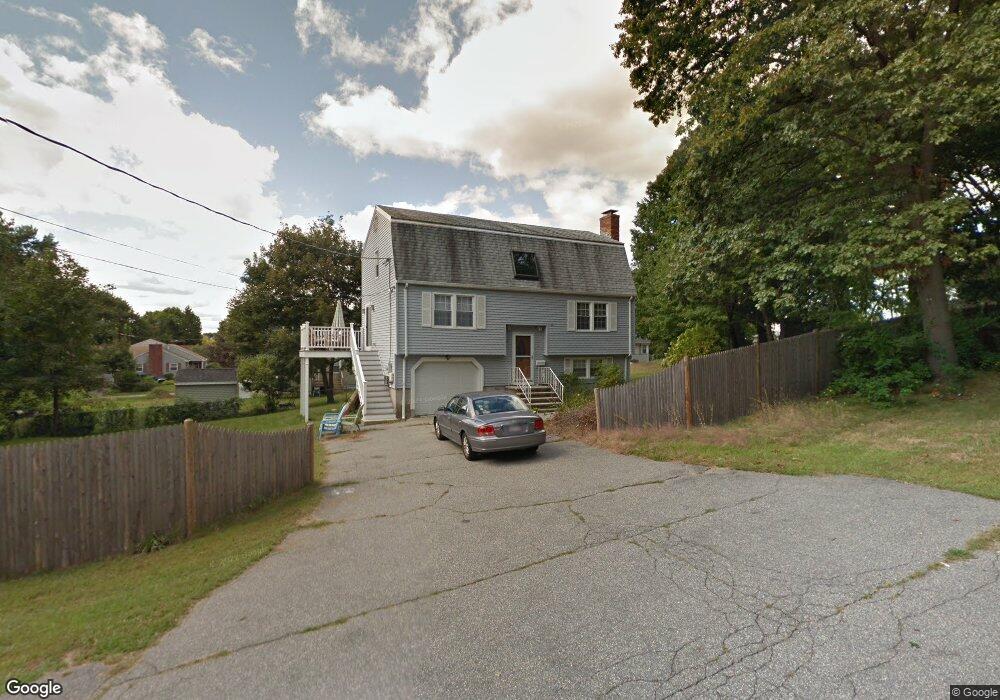
4 Border St Wakefield, MA 01880
Montrose NeighborhoodEstimated Value: $750,244 - $834,000
3
Beds
2
Baths
2,063
Sq Ft
$385/Sq Ft
Est. Value
About This Home
This home is located at 4 Border St, Wakefield, MA 01880 and is currently estimated at $794,561, approximately $385 per square foot. 4 Border St is a home located in Middlesex County with nearby schools including Wakefield Memorial High School, St Joseph School, and Odyssey Day School.
Ownership History
Date
Name
Owned For
Owner Type
Purchase Details
Closed on
May 31, 1996
Sold by
Moran John R and Moran Carolyn P
Bought by
Wohler C William and Wohler Gina M
Current Estimated Value
Purchase Details
Closed on
Dec 3, 1991
Sold by
Agri Joseph J and Agri Theresa S
Bought by
Moran John R and Moran Carolyn P
Create a Home Valuation Report for This Property
The Home Valuation Report is an in-depth analysis detailing your home's value as well as a comparison with similar homes in the area
Home Values in the Area
Average Home Value in this Area
Purchase History
| Date | Buyer | Sale Price | Title Company |
|---|---|---|---|
| Wohler C William | $182,000 | -- | |
| Moran John R | $146,500 | -- |
Source: Public Records
Mortgage History
| Date | Status | Borrower | Loan Amount |
|---|---|---|---|
| Open | Moran John R | $12,000 | |
| Open | Moran John R | $195,000 | |
| Closed | Moran John R | $174,900 |
Source: Public Records
Tax History
| Year | Tax Paid | Tax Assessment Tax Assessment Total Assessment is a certain percentage of the fair market value that is determined by local assessors to be the total taxable value of land and additions on the property. | Land | Improvement |
|---|---|---|---|---|
| 2025 | $7,177 | $632,300 | $366,800 | $265,500 |
| 2024 | $7,072 | $628,600 | $364,600 | $264,000 |
| 2023 | $6,724 | $573,200 | $332,500 | $240,700 |
| 2022 | $6,434 | $522,200 | $302,900 | $219,300 |
| 2021 | $6,847 | $537,900 | $282,500 | $255,400 |
| 2020 | $6,422 | $502,900 | $264,100 | $238,800 |
| 2019 | $6,134 | $478,100 | $251,100 | $227,000 |
| 2018 | $5,712 | $441,100 | $231,600 | $209,500 |
| 2017 | $5,372 | $412,300 | $216,500 | $195,800 |
| 2016 | $5,280 | $391,400 | $204,800 | $186,600 |
| 2015 | $4,931 | $365,800 | $191,400 | $174,400 |
| 2014 | $4,496 | $351,800 | $184,100 | $167,700 |
Source: Public Records
Map
Nearby Homes
- 57 Wave Ave
- 68 Preston St Unit 6D
- 67 Woodcrest Dr
- 29 Cordis St
- 16 Pleasant St
- 350 Water St
- 16 Beebe Ln
- 9 Cyrus St
- 43-45 Crescent St
- 10 Wakefield Ave Unit B
- 270 Lowell St
- 35 Richardson St Unit 2
- 5 Jessica Ln
- 21 Herbert St Unit A
- 1 Traverse St Unit E
- 50 Tuttle St Unit 12
- 61 Nahant St
- 62 Foundry St Unit 310
- 62 Foundry St Unit 204
- 62 Foundry St Unit 402
- 7 Grand Passway St
- 11 Grand Passway St
- 202 Salem St
- 3 Border St
- 1 Border St
- 206 Salem St
- 134 New Salem St
- 132 New Salem St
- 2 County Rd
- 13 Baldwin Rd
- 14 Baldwin Rd
- 140 New Salem St
- 192 Salem St
- 192 Salem St Unit 2
- 203 Salem St
- 144 New Salem St
- 205 Salem St
- 31 Appleton Rd
- 133 New Salem St
- 137 New Salem St
Your Personal Tour Guide
Ask me questions while you tour the home.